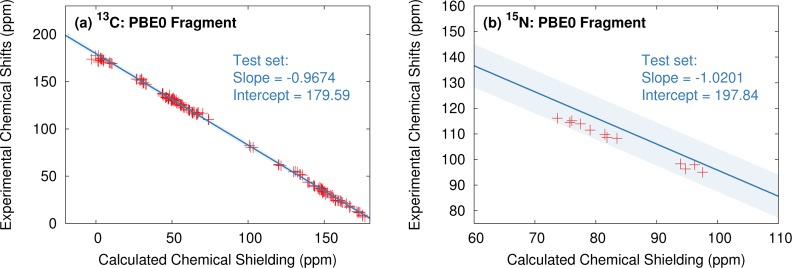
Figure 16.
Comparison between the shielding regression line from ref (78) (in blue) and the chemical shifts predicted here (in red) for (a) the 13C isotropic shieldings and (b) the 15N isotropic shieldings. The blue-shaded region indicates plus or minus two standard deviations in the errors from the ref (78) benchmarks.

