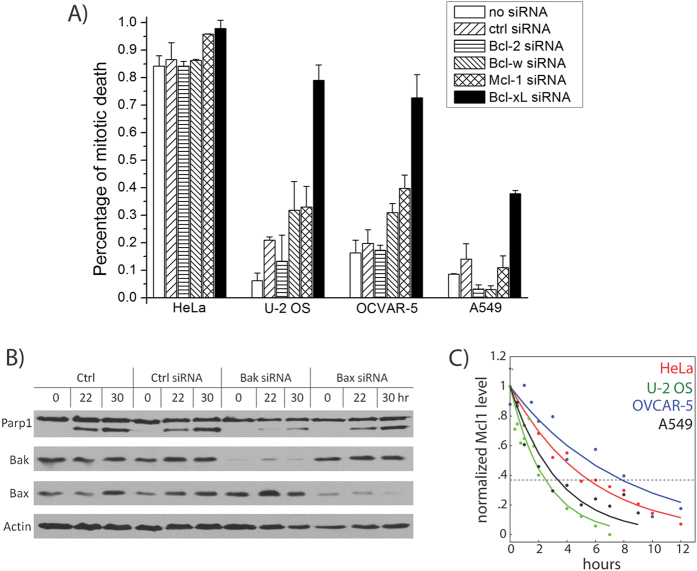
Figure 1. Defining key Bcl-2 network components for mitotic death control in different cell lines.
(A) Inhibitory Bcl-2 family proteins were knocked down using siRNA treatment in the indicated cell lines. Cells were arrested in mitosis by treatment with an anti-mitotic drug, Kinesin-5 inhibitor (K5I), and dead cell percentages were then scored after 48 hours of drug treatment using time-lapse microscopy. Data were re-plotted from ref. 9. (B) Pro-apoptotic Bcl-2 family proteins Bax and Bak were knocked down in HeLa cells, using RNAi. Cells were then arrested in mitosis by K5I, and analyzed using western blotting for Parp1 cleavage, an indicator of apoptotic death. Results showed that knockdown of Bak, but not Bax, attenuates mitotic cell death. (C) Cells were arrested in mitosis using K5I treatment, and analyzed for Mcl-1 levels using quantitative western blotting at the indicated time points. Plot shows Mcl-1 levels over time, with curves indicating best fits to a single exponential decay in the form of f(t) = A0 exp (−t/τ). The decay time constants τ derived here are subsequently used to constrain modeling fits.

