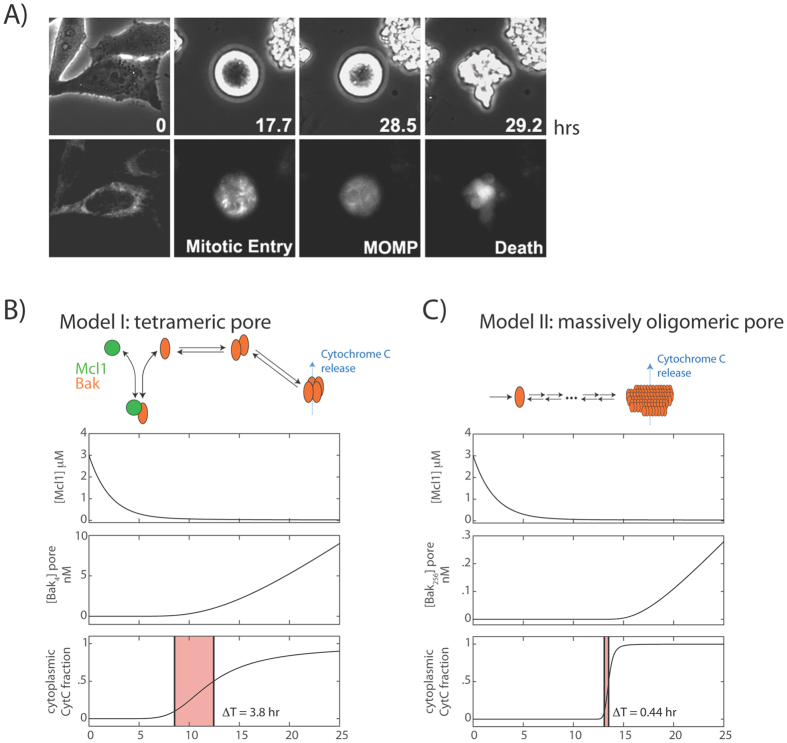
Figure 2. Switch-like apoptosis induction during mitotic arrest requires large oligomeric mitochondrial membrane pores.
(A) Kinetics of MOMP in HeLa cells arrested in mitosis from time-lapse imaging. To induce mitotic arrest, cells were treated with 1 μM K5I at t = 0 hrs. Still frames show phase-contrast images (top), and fluorescence images of the MOMP reporter, IMS-RP (bottom), which consists of monomeric red fluorescent protein targeted to the inter-membrane space of mitochondria by fusion to the leader peptide of SMAC10. In this example, the cell rounded up to enter mitosis at t = 17.7 hrs after drug addition, underwent MOMP at t = 28.5 hrs, indicated by a change from punctate to smooth distribution in fluorescence, and started to bleb and lyse about 20 minutes later (t = 29.2 hr). (B,C) Candidate models for explaining the observed kinetics of apoptosis induction, involving either the formation of a tetrameric Bak pore (B), or a massively oligomeric Bak pore with hundreds of subunits (C). Plots show simulated time evolution of free Mcl-1 concentrations (top), mitochondrial Bak pore concentrations (middle), and fraction of cytoplasmic CytC (bottom), an indicator of death induction. Red shaded area indicates the duration of death induction ΔT, defined as the time required for the cytoplasmic CytC fraction to increase from 0.1 to 0.5. The results show that the massively oligomeric pore model (C), but not the tetrameric pore model (B), can sufficiently account for both the delayed and switch-like kinetics of apoptosis induction observed experimentally.

