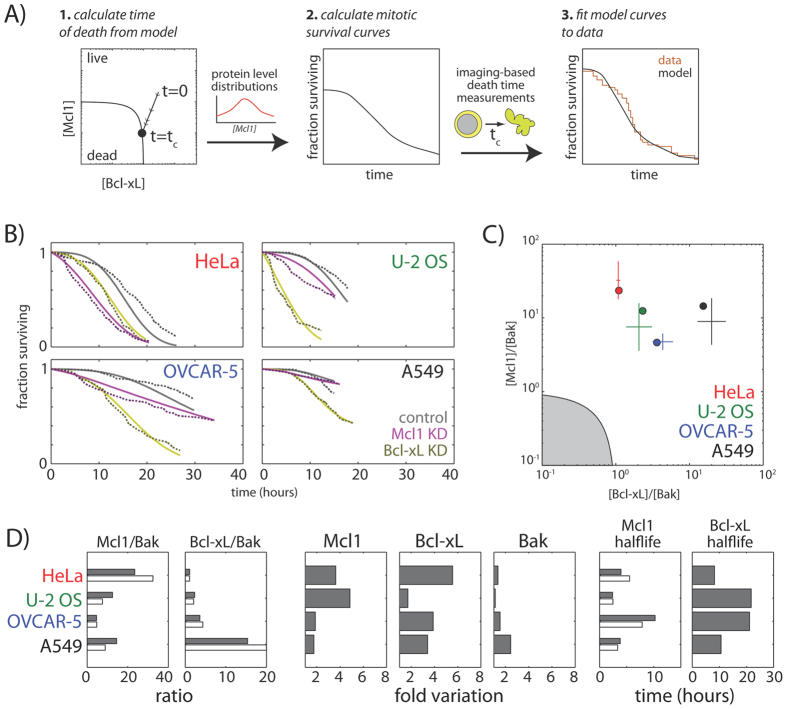
Figure 3. Quantitative insights into cell-to-cell variation in apoptotic response from modeling and computational analysis.
(A) Procedure for fitting model-derived survival curves to experimental data. Mitotic survival curves derived from dynamical models were fit to experimental data for HeLa, U-2 OS, OVCAR-5 and A549, obtained under both control conditions and upon Mcl-1 or Bcl-xL knockdown. (B) Fraction of mitotically-arrested cells surviving over time under control conditions (grey), upon Mcl-1 knockdown (purple), and upon Bcl-xL knockdown (gold). Dotted lines represent experimental data, and solid lines represent best fits to the model. (C) Mcl-1/Bak versus Bcl-xL/Bak ratios for best model fits to the four cell lines (solid circles). Crosses represent relative ratios between the cell lines measured by western blotting (mean and standard deviation, N = 3). Gray shaded area represents forbidden region where Mcl-1 and Bcl-xL levels are insufficient to maintain normal cell survival. (D) Histograms showing best fit model parameters (solid bars), along with experimentally measured values (hollow bars). Fold variation shows cell-to-cell variability in protein levels, as modeled using a log-normal distribution. Here, measured Mcl-1 and Bcl-xL to Bak ratios are scaled by constant factor to allow comparison with model parameters.

