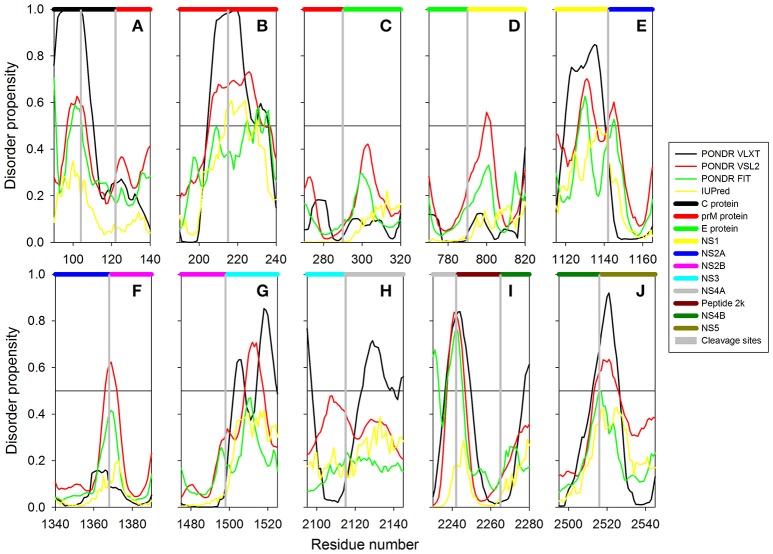
Figure 3.
The role of intrinsic disorder in maturation of individual proteins of Zika virus. Plots shows position of cleavage sites (gray vertical bars) in relation to disorder profiles at the junction between the individual proteins within the polyprotein. (A) A cleavage site between proteins C (black horizontal bar) and prM (red horizontal bar). A cleavage site at the position 104 within the pro-protein C leading to the removal of propeptide (residues 105–122) is also shown. (B) A cleavage site within the prM protein leading to generation of proteins Pr and M. (C) A cleavage site between the proteins prM (red horizontal bar) and E (green horizontal bar). (D) A cleavage site between the proteins E (green horizontal bar) and NS1 (yellow horizontal bar). (E) A cleavage site between the proteins NS1 (yellow horizontal bar) and NS2A (blue horizontal bar). (F) A cleavage site between the proteins NS2A (blue horizontal bar) and NS2B (pink horizontal bar). (G) A cleavage site between the proteins NS2B (pink horizontal bar) and NS3 (cyan horizontal bar). (H) A cleavage site between the proteins NS3 (pink horizontal bar) and NS4A (gray horizontal bar). (I) Cleavage sites between the protein NS4A (gray horizontal bar) and the peptide 2k (dark red horizontal bar) and the peptide 2k (dark red horizontal bar) and protein NS4B (dark green horizontal bar). (J) A cleavage site between the proteins NS4B (dark green horizontal bar) and NS5 (dark yellow horizontal bar).

