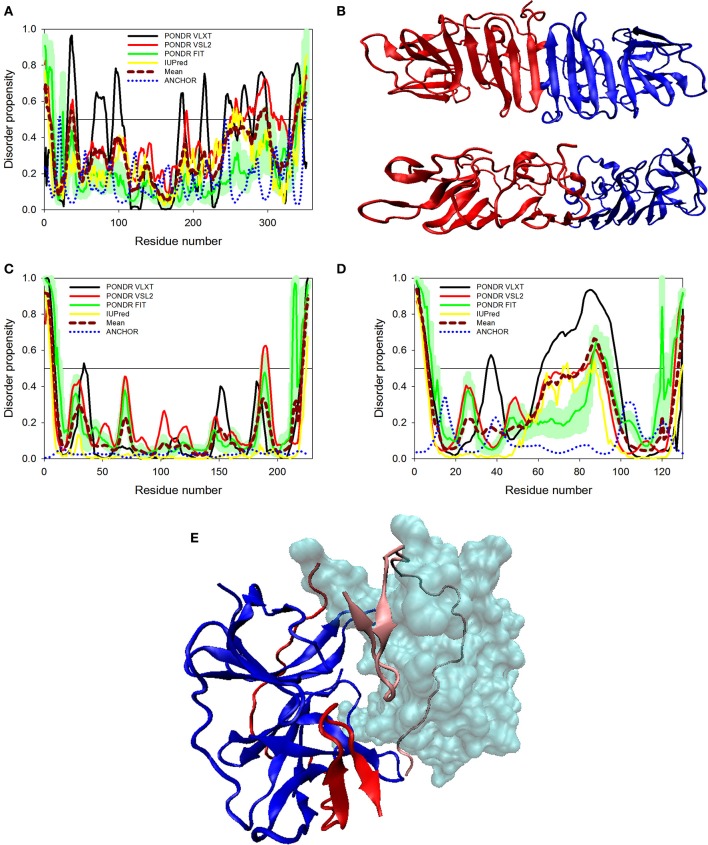
Figure 5.
Disorder predispositions of non-structural proteins NS1 (A), NS2A (C) and NS2B (D). Disorder profiles generated by PONDR® VLXT, PONDR® VSL2, PONDR® FIT, and IUPred are shown by black, red, green, and yellow lines, respectively. Dark red dashed line shows the mean disorder propensity calculated by averaging disorder profiles of individual predictors. Light green shadow around the PONDR® FIT shows error distribution. Blue dotted lines correspond to the result of the functional disorder analysis using ANCHOR algorithm. (B) 3D-structure of the head-to-head dimer of the NS1 protein, where the β-ladder side (top) and loop arrangement (bottom) are shown. Structure is based on the PDB ID: 5IY3 (Song et al., 2016). Structures of monomers within a dimer are shown as blue and red cartoons. (E) 3D-structure of a hybrid protein containing NS3-binding region of the NS2B protein covalently linked to the protease domain of ZIKV NS3 protein (PDB ID: 5LC0) (Lei et al., 2016). This hybrid protein is crystallized as a tight dimer. Structures of the NS3-binding region of the NS2B protein are shown as red or pink ribbons in chains (A,B) of this dimer, respectively. Structures of the protease domain of NS3 protein are shown as blue ribbon or cyan surface in chains (A,B), respectively. For chain (B), this domain is shown as a transparent surface to simplify visualization of the NS2 chain wrapped around it. Structural representation have been rendered using VMD (Humphrey et al., 1996).

