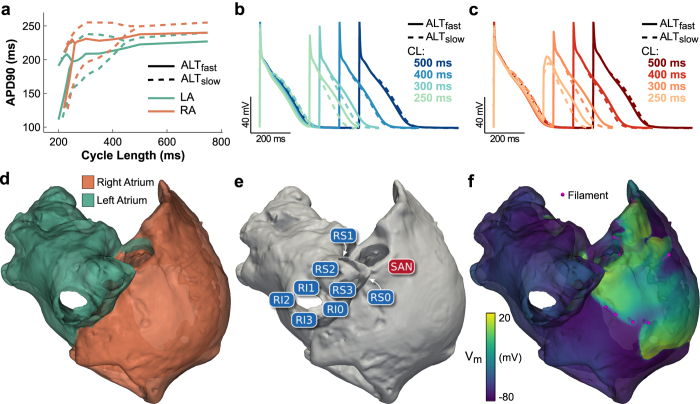
Figure 1. Human atria model.
(a) Single cell APD restitution for ALTfast (solid line) and ALTslow (dashed line) AP models, using left atrium (LA, green) or right atrium (RA, orange) chronic AF K+ current densities from Grandi et al.45 Bifurcation of the APD restitution curve indicates alternans occurring at that pacing CL. (b) LA cell APs for the ALTfast and ALTslow models at different pacing CLs. (c) RA cell APs for the ALTfast and ALTslow models at different pacing CLs. (d) LA and RA regions in the human atria model. (e) Stimulus locations. (f) Detection of filaments during arrhythmia.

