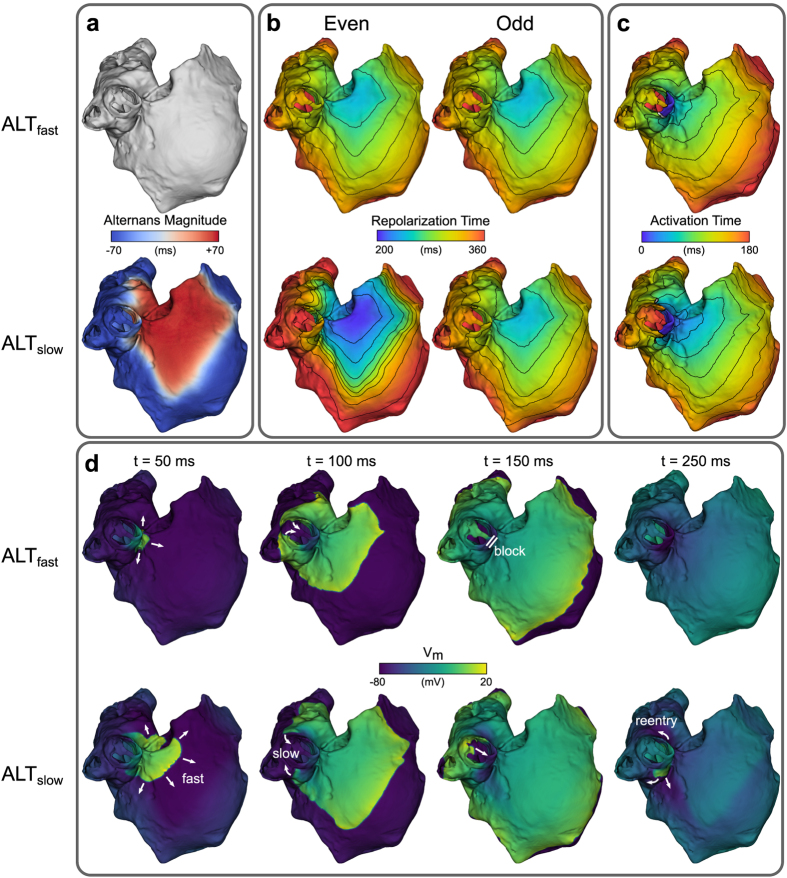
Figure 2. Discordant APD alternans during S1 pacing and induction of reentry by an S2 stimulus.
(a) APD alternans magnitude. Regions of opposite phase are shown in different colors (red vs. blue). (b) Time to 90% repolarization after even (left) and odd (right) paced beats. (c) Activation time maps after an S2 stimulus was delivered from RS0 (see Fig. 1E) at a coupling interval of 280 ms following an even S1 beat. (d) Transmembrane potential (Vm) maps showing conduction block and reentry following the S2 stimulus in panel (c). Top rows: ALTfast. Bottom rows: ALTslow.

