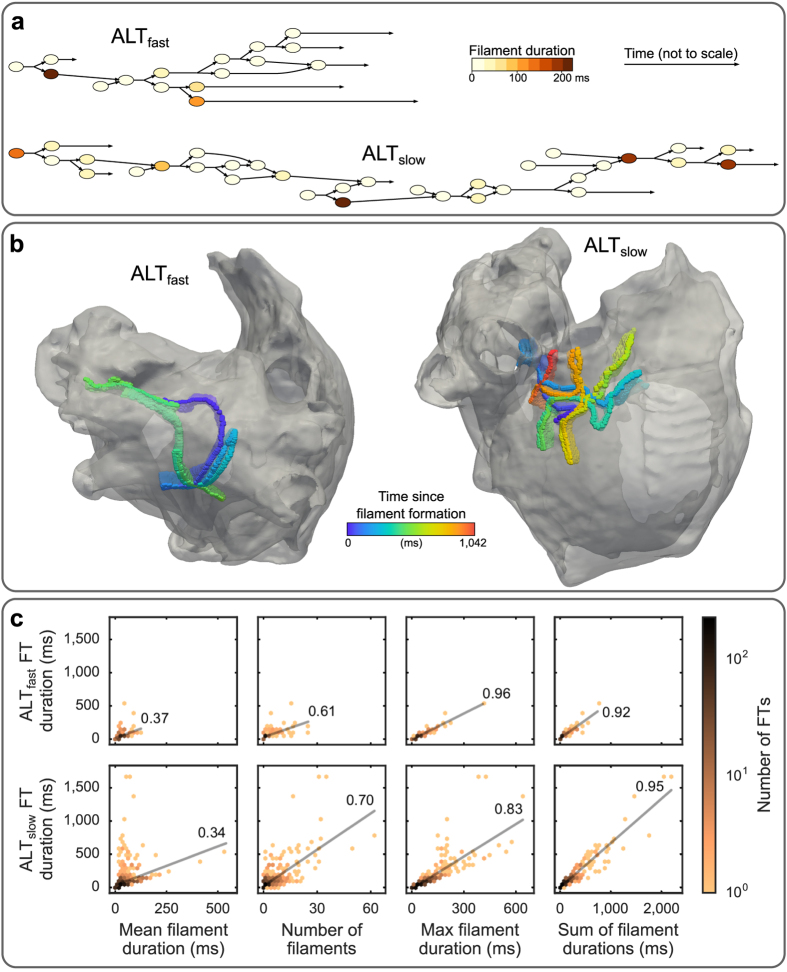
Figure 6. Composition of FTs during fast pacing.
(a) Graphs of FT branching structure from two example FTs in ALTfast (top) and ALTslow (bottom) simulations. Filament duration is indicated by node colors; time is not drawn to scale. (b) Trajectories of ALTfast (left) and ALTslow (right) FTs from panel (a). (c) Correlation between FT duration and FT composition metrics. Top: ALTfast. Bottom: ALTslow. Left to right: mean filament duration, number of filaments, maximum filament duration, and sum of filament durations. Linear best fit lines and Pearson correlation coefficients are shown in each plot.

