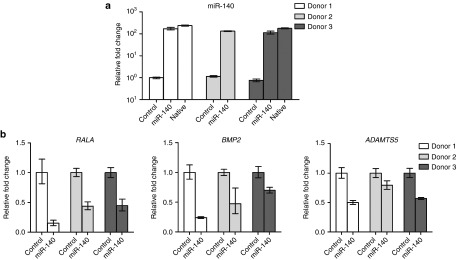
Figure 2.
Functional analysis of miR-140 2 days after electroporation. (a) RT-qPCR analysis of miR-140 levels in ACs electroporated with a negative control sequence (Control), miR-140 and in native articular cartilage. (b) Relative expression of RALA, BMP2, and ADAMTS5 in control cells and miR-140 electroporated cells. Cells from three donors were used in a and b. U6 and GAPDH were used as a reference genes in a and b, respectively. In a and b the cells were stimulated for 20 hours before analysis. In c the cells were stimulated for 0, 30 minutes, 1, 3, 5, 8, 20, and 48 hours. In d the cells were stimulated for 1, 2, 5, and 7 days. Min, minutes; h, hours. RT-qPCR, real time-quantitative polymerase chain reaction; ACs, articular chondrocytes.

