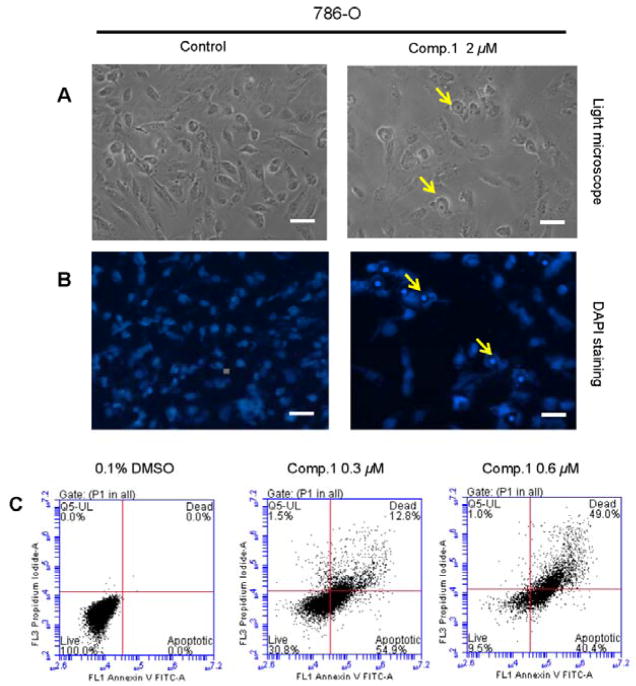
Figure 4.
Compound 1 induces apoptosis in 786-O cells. (A) RCC cell morphology under phase-contrast light microscope (Magnification: × 200, bar = 20 μm). A representative picture was shown from a random field. (B) DAPI staining of nuclear morphology under fluorescence microscope (Magnification: × 200, bar = 20 μm). A representative picture was shown from a random field. (C) The cells were treated with 0.3 and 0.6 μM 1 for 72 h. After stained by AnnexinV and PI, the cells were analyzed by flowcytometry. Data represent the means from 3 independent experiments. Standard errors are less than 5%.

