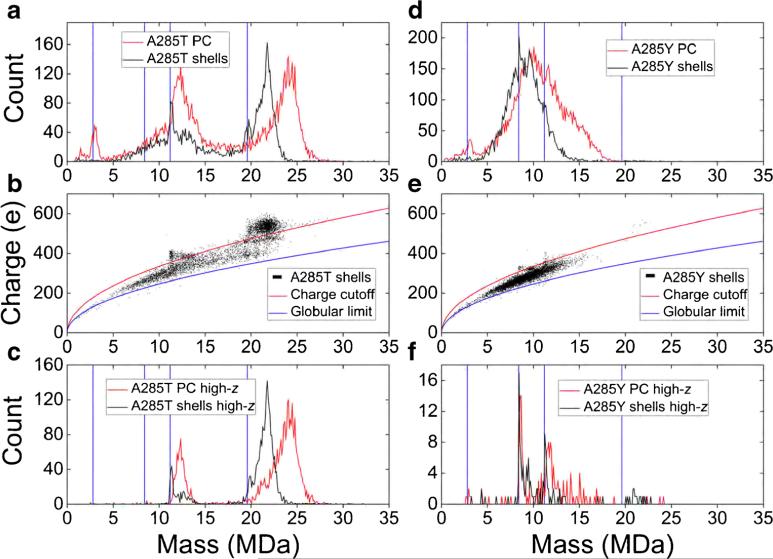
Figure 3.
(a) Mass spectra of formaldehyde cross-linked P22 procapsids (PCs, red) and GuHCl-treated ‘shells’ (black) made from A285T variant coat protein. (b) Charge versus mass scatterplot of ‘shells’ from part a (black). The blue curve is the Rayleigh limit for globular proteins (see text). The red curve has the same form, but its proportionality constant was adjusted to separate the broad, low-charge baseline from the more highly charged ions. (c) Mass spectra of ions in part (a), which lie above the red curve in part (b). (d)–(f) A285Y analogues of parts (a)–(c). Blue, vertical lines are the expected theoretical masses of empty T = 1, 3, 4, and 7 P22 PCs. All the spectra are histograms with 100 kDa bins

