. 2016 Sep 19;5:e13214. doi: 10.7554/eLife.13214

Figure 1. Experimental and analysis procedures for cell-type-specific circuit tracing.

(A) RV-mediated transsynaptic retrograde tracing of BF inputs. Upper panel, viral vectors and injection procedure. Lower panel, fluorescence images of BF in the region of the NDB (red box in coronal diagram) in ChAT-, VGLUT2-, PV-, and SOM-Cre mice. Scale bar, 200 µm. Inset, enlarged view of the region in white box showing starter cells (yellow, expressing both eGFP and tdTomato, indicated by white arrowheads). Scale bar, 50 µm. NDB, diagonal band nucleus; SIB, substantia innominata, basal part; MCPO, magnocellular preoptic nucleus; VP, ventral pallidum; LPO, lateral preoptic area. (B) Viral vector and injection procedure for tracing BF axonal projections. (C) Flow chart showing the main steps in data generation and processing.

DOI: http://dx.doi.org/10.7554/eLife.13214.002

© 2008 Elsevier. All Rights Reserved

Lower panel, brain outline adapted from Figure 32 from The Mouse Brain in Stereotaxic Coordinates, 3rd edition, Franklin, K.B.J. and Paxinos, G.

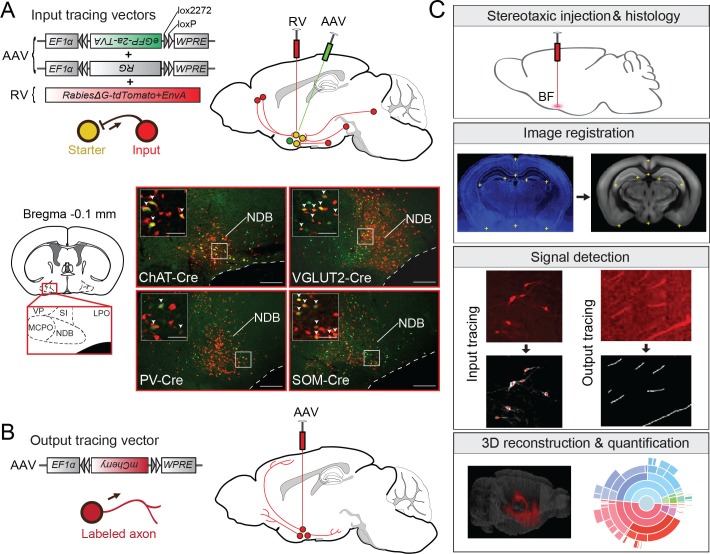
Figure 1.

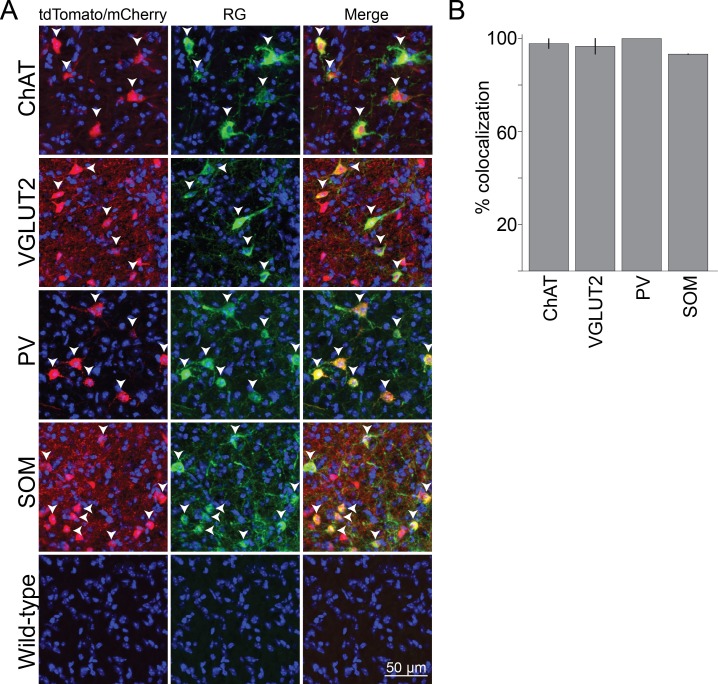
Figure 1—figure supplement 1. Cell-type specificity of Cre-dependent rabies glycoprotein expression.

Figure 1—figure supplement 1.

(A) Colocalization of rabies glycoprotein immunostaining with Cre expression (indicated by tdTomato or mCherry reporters) in each of the four Cre lines. White arrowheads indicate cells with colocalization. No rabies glycoprotein expression was detected when injected into wild type mice. (B) Percentage of rabies glycoprotein expressing cells that are positive for tdTomato or mCherry, averaged across brain samples. Error bar, ± standard deviation (91 ChAT cells; 89 VGLUT2 cells; 70 PV cells; 100 SOM cells; n = 2 mice per line).

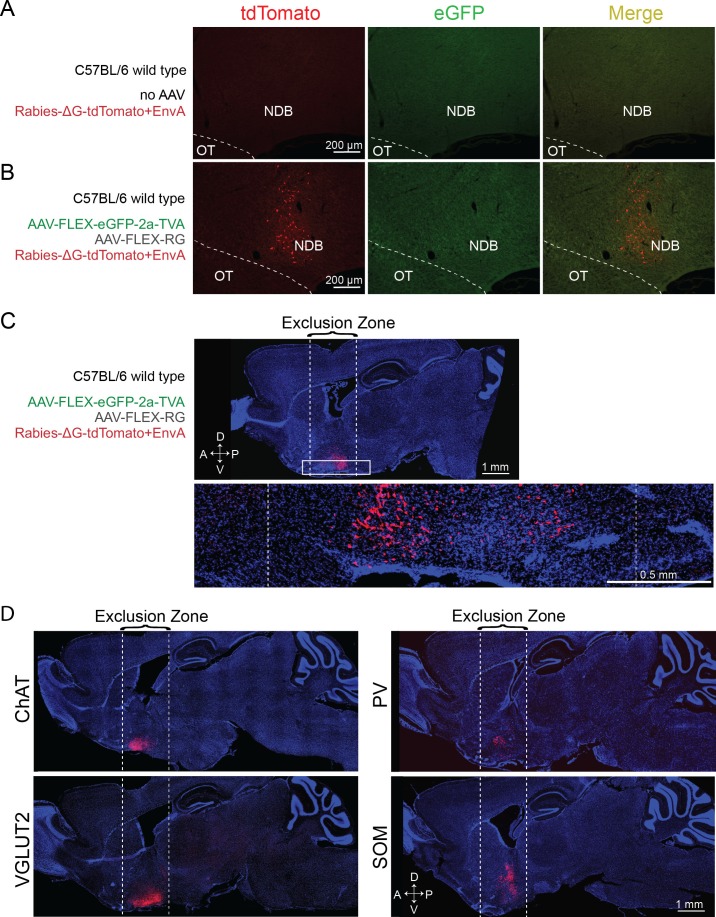
Figure 1—figure supplement 2. Control experiments for RV tracing of inputs.

Figure 1—figure supplement 2.

(A) Injection of RV without prior AAV injection resulted in no tdTomato-labeled neurons, indicating dependence of the RV infection on AAV-induced expression of TVA. (B) Injection of AAV2-EF1α-FLEX-eGFP-2a-TVA and AAV2-EF1α-FLEX-RG followed by RV injection in the BF of wild-type mice not expressing Cre led to no eGFP expression, indicating Cre-dependence of the AAV vector. However, tdTomato-labeled neurons were observed at the injection site (radius < 500 μm), most likely due to the leaky expression of a low level of TVA, as previously noted (Miyamichi et al., 2013; Wall et al., 2013). (C) Upper panel, Sagittal view of the experiment shown in B (but a different brain sample), with a tdTomato expression near the injection site but not outside of the exclusion zone. Lower panel, enlarged view of the region in the white rectangle. (D) Sagittal view of brain samples injected with AAV2-EF1α-FLEX-eGFP-2a-TVA followed by RV in the BF of different Cre lines (without AAV2- EF1α-FLEX-RG that enables transsynaptic spread of RV) to determine the spatial extent of the exclusion zone in the RV tracing experiments. After excluding the horizontal limb of the diagonal band of Broca (part of the BF region targeted), we found very few (<30 per brain) labeled cells beyond 850 μm. Subsequent analyses were thus performed only in coronal sections >850 μm from the injection site and outside of the horizontal limb of the diagonal band of Broca.

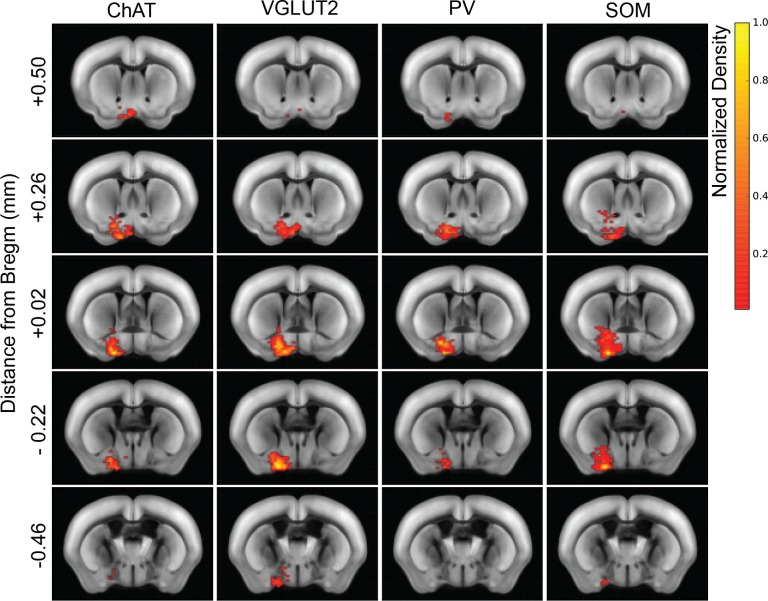
Figure 1—figure supplement 3. Heat map distribution of starter cells.

Figure 1—figure supplement 3.

Normalized starter cell density across all samples for each cell type. Each brain slice depicts the density accumulated from an anterior-posterior axis range of 0.24 mm.

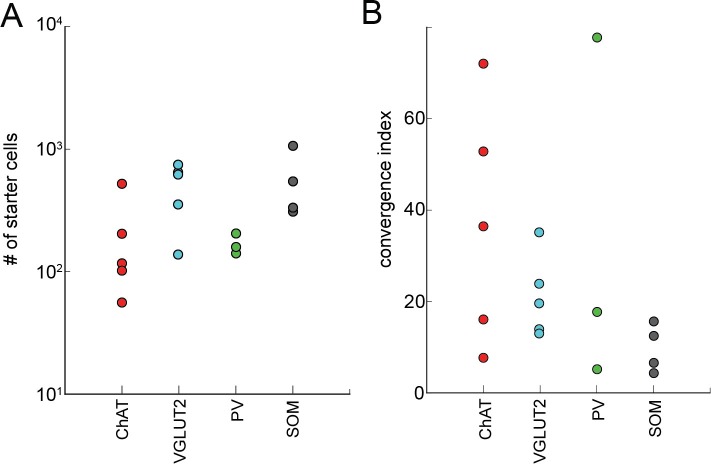
Figure 1—figure supplement 4. The relationship between the numbers of starter cells and input cells.

Figure 1—figure supplement 4.

(A) The total number of starter cells for each brain sample. (B) The convergence index (input cell count/starter cell count) for each brain sample grouped by cell-type.