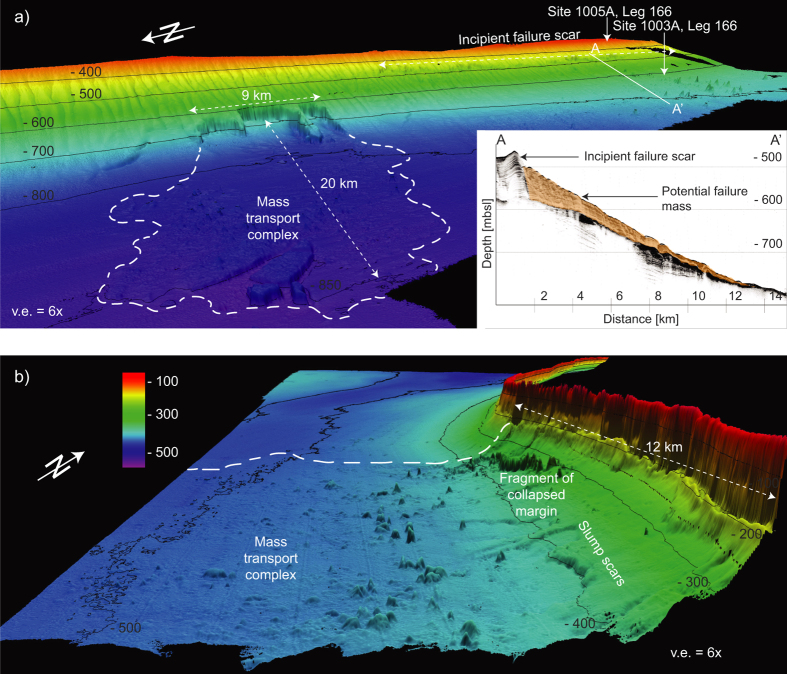
Figure 2.
(a) Slope failures along western Great Bahama Bank. The scar visible on the lower slope and the associated mass transport complex in the basin. The smaller landslide was simulated using the extent of the middle part of the failure scar. The incipient failure scar (IFS), transect A-A’ is also visible in the subbottom profile. (b) Margin collapse and the associated mass wasting products on the southwest corner of GBB. (The 3D bathymetry was produced using QPS Fledermaus v.7 http://www.qps.nl/display/fledermaus/main;jsessionid = C177527398736B33CF4E7113060481F5. The subbottom profle was produced using Reflex v.6 (http://www.sandmeier-geo.de/reflexw.html).

