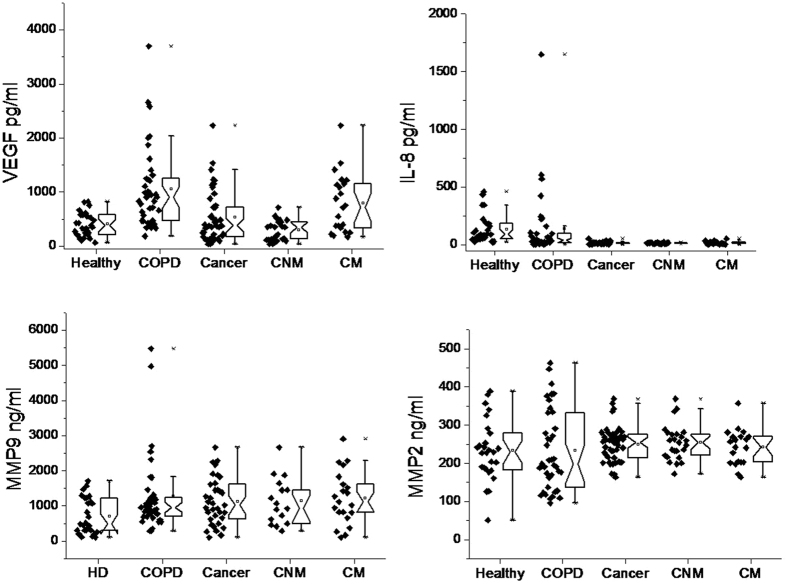
Figure 2. Individual values for different analytes were shown along with respective box-and-whisker plots.
The notched point of plots show the mean value and upper and lower parts represent 25 and 75%, respectively. x: represent lower or upper values of the range. Abbreviations are same as Fig. 1.

