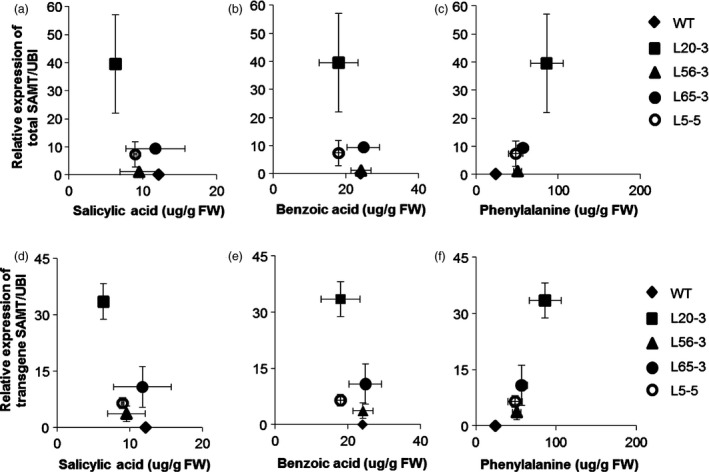
Figure 6.

Correlation between leaf metabolites assayed and the relative expression of GmSAMT1 in roots (a) Correlation between salicylic acid and the relative expression of total GmSAMT1 (r = −0.42, P = 0.116). (b) Correlation between benzoic acid and the relative expression of total GmSAMT1 (r = −0.31, P = 0.258). (c) Correlation between phenylalanine and the relative expression of total GmSAMT1 (r = 0.70, P = 0.004). (d) Correlation between salicylic acid and the relative expression of transgene GmSAMT1 (r = −0.39, P = 0.151). (e) Correlation between benzoic acid and the relative expression of transgene GmSAMT1 (r = −0.37, P = 0.179). (f) Correlation between phenylalanine and the relative expression of transgene GmSAMT1 (r = 0.86, P < 0.001). Horizontal error bars represent the standard error of metabolite amount from two biological replicates. Vertical error bars represent standard error of the relative gene expression level from three biological replicates. Nontransgenic Williams 82 (WT) soybean as control and 35S:SAMT T3 homozygous transgenic soybean lines L5‐5, L20‐3, L56‐3 and L65‐3 with overexpression of GmSAMT1 were studied.
