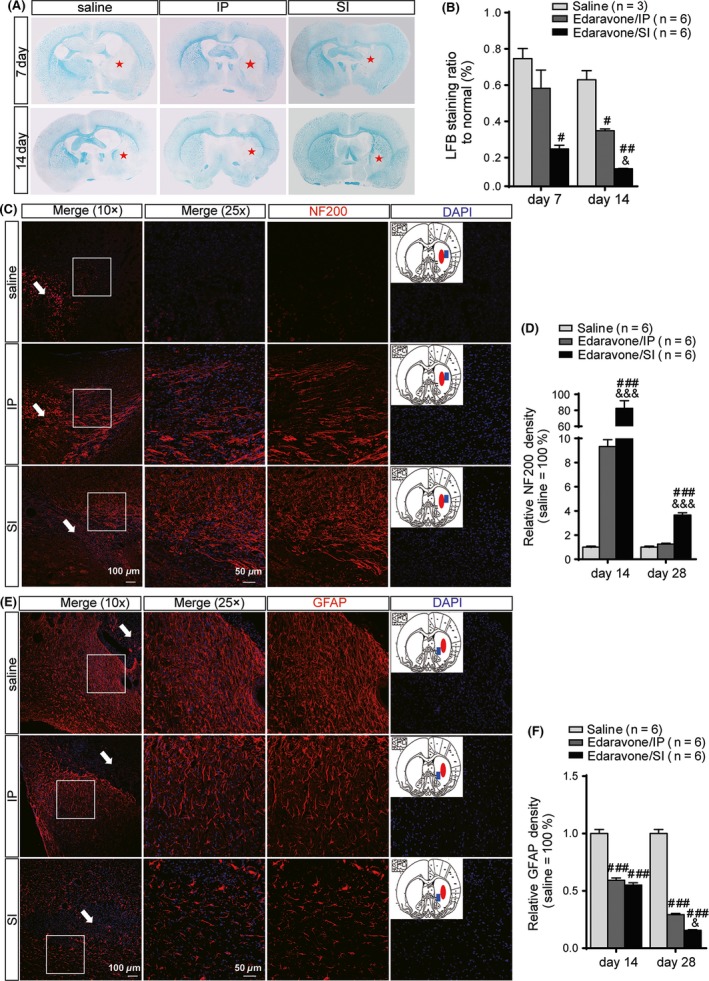
Figure 4.

Evaluation of neuropathology in axon, astrocyte activation, and myelination. (A) Representative brain coronal sections (2 mm thickness) show the degree of myelination by Luxol fast blue(LFB) staining. (B) The LFB staining ratio to normal is significantly lower in SI than the saline group at both days 7 and 14 post‐intracerebral hemorrhage (ICH) and the IP group on day 14 post‐ICH. (C) Molecular marker NF200 (red fluorescence) was used to assess neuropathology improvement in axon by immunostaining. Anatomy diagram of rat brain in each treatment group shows the hemorrhagic foci (red solid ellipse) and sampling location (blue solid square). Merged images (25×) are sampled from the white square in the corresponding low magnification images (10×), where the white arrows indicate the hemorrhagic foci.(D) The expression of NF200 in SI increased significantly higher than that in the saline and IP groups. (E) Molecular marker glial fibrillary acidic protein (GFAP) (red fluorescence) was used to assess astrocyte activation by immunostaining. Anatomy diagram of rat brain in each treatment group shows the hemorrhagic foci (red solid ellipse) and sampling location (blue solid square). Merged images (25×) are sampled from the white square in the corresponding low magnification images (10×), where the white arrows indicate the hemorrhagic foci.(F) The expression of GFAP decreased significantly in SI and IP than in the saline group. Both the density values of LFB staining and the fluorescence intensity values were calculated by Image‐Pro Plus 6.0. # P < 0.05, ## P < 0.01, ### P < 0.001 versus the saline group; & P < 0.05, && P < 0.01, &&& P < 0.001 versus the IP group. Red stars indicate myelin sheath damage region.
