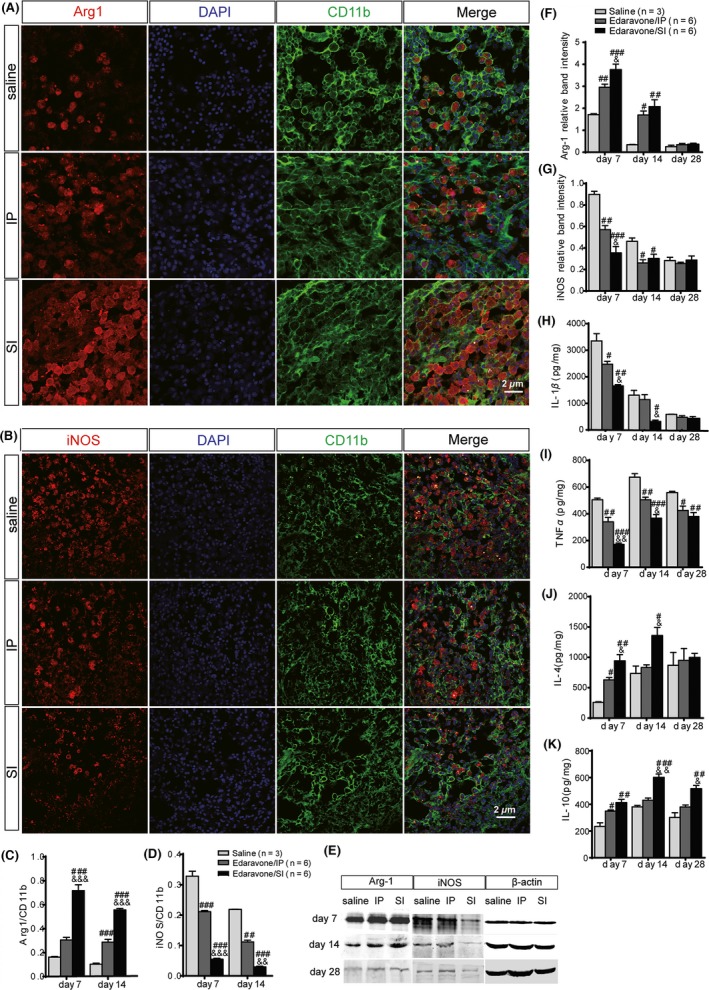
Figure 5.

Assessment of microglia differentiation and cytokines’ levels in rat brain tissues. Microglia differentiation was observed by immunofluorescent staining. Arginase‐1 (A) (red) is a marker of M2 microglia. iNOS (B) (red) is a marker of M1 microglia. CD11b (green) is another epitope for microglia. The Arginase‐1/CD11b (C) revealed the polarization degree of M2 microglia. In the SI group, microglia differentiated higher markedly into type M2 than that in the saline and IP groups. The iNOS/CD11b (D) revealed the polarization degree of M1 microglia. The polarization degree of M1 microglia in SI was inhibited more dramatically than that in the saline and IP groups at days 7 and 14 post‐intracerebral hemorrhage. (E) Microglia differentiation was evaluated by iNOS and arginase‐1 semiquantitative analysis using Western blot. Arginase‐1 (F) level increased significantly in SI than in the IP group at days 7 and 14 post‐operation. On the contrary, iNOS (G) level decreased significantly. The relative band intensity was normalized to the level of β‐actin. The level of a serial inflammantory and anti‐inflammantory molecules, IL‐1β (H), TNF‐α (I), and IL‐4 (J) as well as IL‐10 (K) were studied by ELISA. # P < 0.05, ## P < 0.01, ### P < 0.001 versus the saline group; & P < 0.05, && P < 0.01, &&& P < 0.001 versus the IP group.
