
Figure 6.
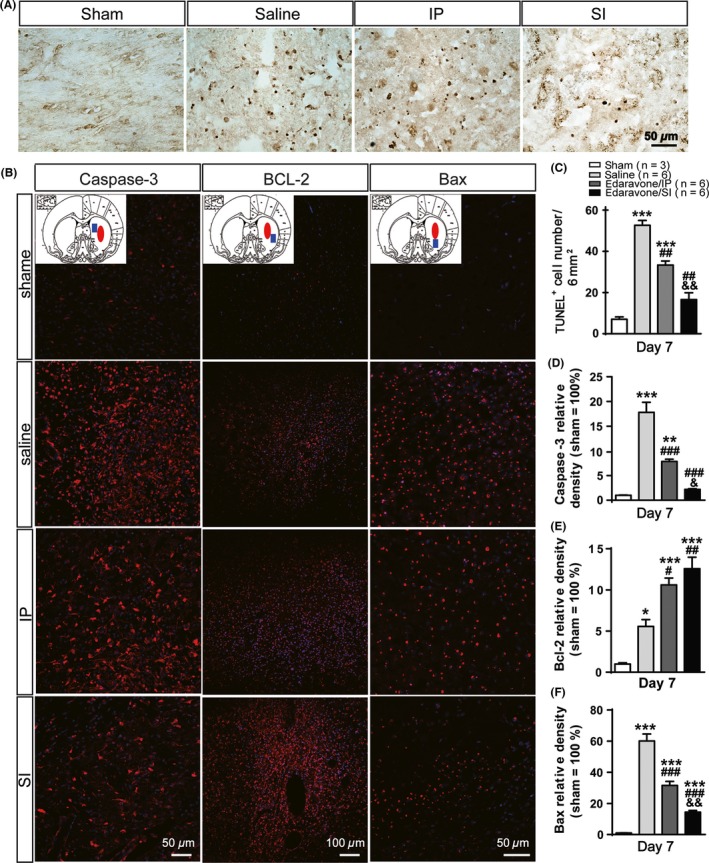
The detection of dying cells and apoptosis‐related proteinsat day 7 post‐intracerebral hemorrhage (ICH). (A) Detection of apoptosis by the TUNEL assay. Typical apoptotic morphology is indicated in brown. (B) The levels of apoptosis‐related proteins, caspase‐3, Bcl‐2 and Bax, in brain tissues were assessed by the fluorescent confocal microscopy. Anatomy diagram of rat brain at each gene column shows the sampling location (blue solid square) relative to the hemorrhagic foci (red solid ellipse) (C) ICH‐induced neural cellsapoptosis. Edaravone could inhibit significantly the process of apoptosis in SI compared with the IP group. Caspase‐3 (D) and Bax (F) both have lower expression in the SI group than in the IP group. And the expression of Bcl‐2 increased more obviously in SI than in other groups (E). *P < 0.05,**P < 0.01,***P < 0.001 versus the sham group; # P < 0.05, ## P < 0.01, ### P < 0.001 versus the saline group; & P < 0.05, && P < 0.01, &&& P < 0.001 versus the IP group.