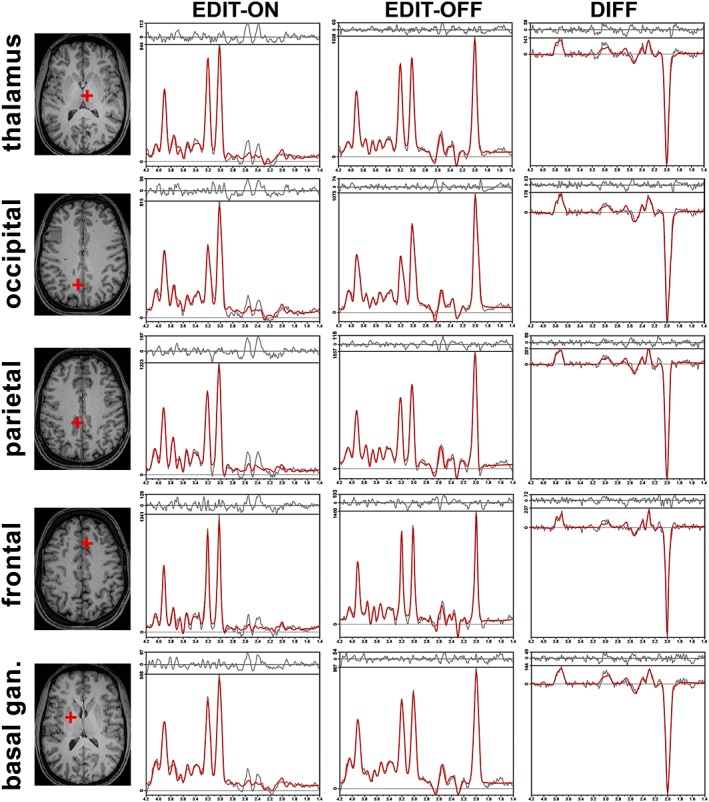
Figure 3.

Samples of in vivo proton MR spectra obtained with the GABA‐editing MEGA‐LASER 3D MRSI sequence. In the first column, localizations of the selected voxel on T 1‐weighted images are shown in the transversal plane; in the second, third, and fourth columns, the LCModel fit of metabolites is shown in the EDIT‐ON (frequency suppression at 1.9 ppm), EDIT‐OFF (frequency suppression at 7.5 ppm), and DIFF (difference spectrum; subtraction of EDIT‐ON and EDIT‐OFF) spectrum, respectively
