
Figure 6.
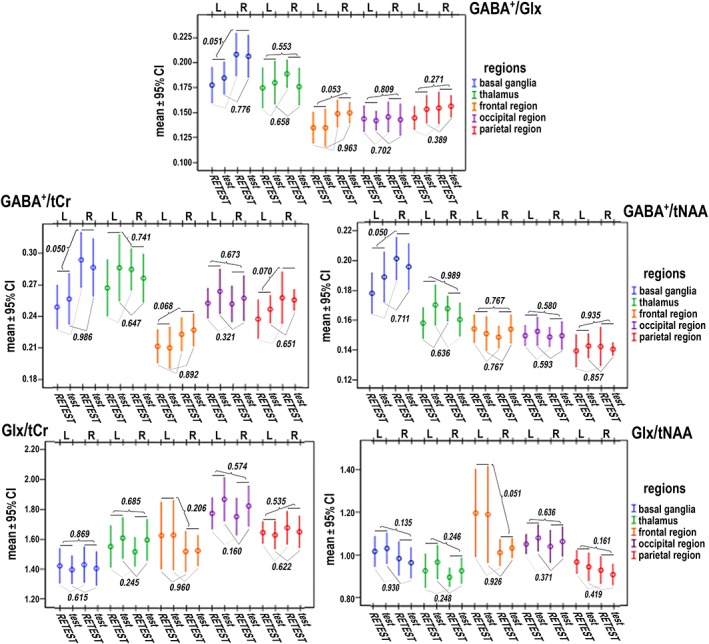
Graphs for intra−/inter‐subject variability of GABA+ and Glx ratios (mean ± 95% confidence interval) evaluated in selected brain regions (n = 56 in each region) with regard to spatial distribution (contralateral regions: 28 voxels for R (right), 28 voxels for L (left)) and repetition of measurement (28 voxels for test, 28 voxels for retest). P values obtained by ANOVA for differences in neurotransmitter ratios between contralateral brain regions (listed above the scatter bars) and test–retest sessions (listed under the scatter bars) are shown