
Figure 1.
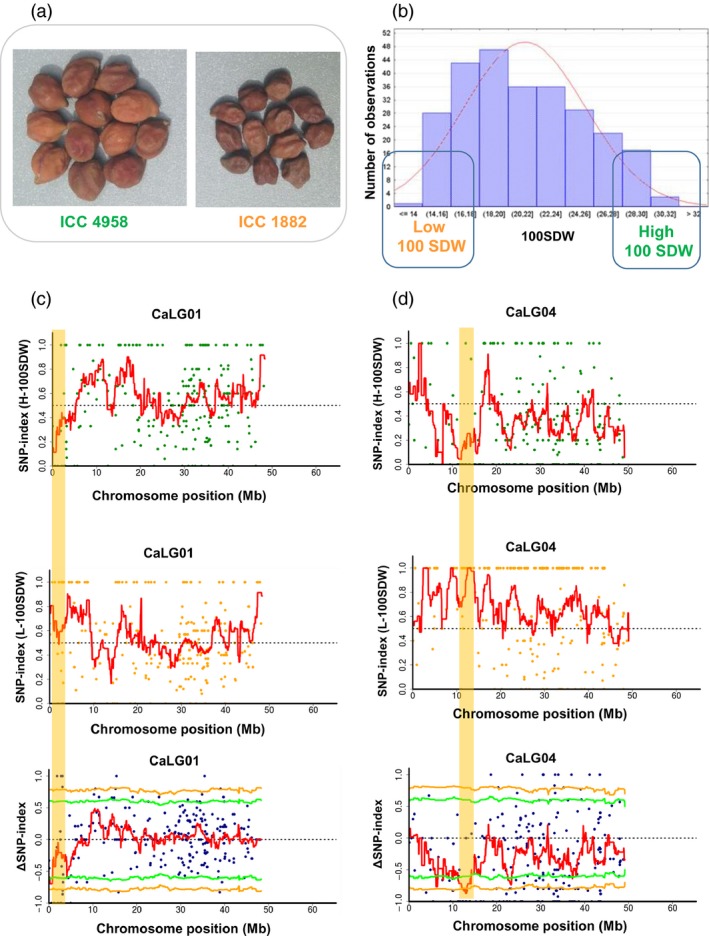
QTL‐seq approach adopted for mapping genomic regions responsible for 100SDW. (a) Image shows the morphological difference of ICC 4958 (tolerant parent with large seed size) and ICC 1882 (sensitive parent with small seed size) (b) Frequency distribution of 100SDW of 262 RILs based on five years of mean data. The DNA of 15 RILs with extreme phenotypes (high and low 100SDW) was used to develop high and low 100SDW bulks. (c) SNP‐index plot of high 100SDW bulk (top), low 100SDW bulk (middle) and ΔSNP‐index plot (bottom) of chromosome 1. The significant genomic regions are highlighted in shaded colour (3.07–4.15 Mb). (d) SNP‐index plot of high 100SDW bulk (top), low 100SDW bulk (middle) and Δ SNP‐index plot (bottom) of chromosome 4. The significant genomic regions are highlighted in shaded colour (11.12–13.82 Mb). The statistical confidence interval under the null hypothesis of no QTLs is presented in the graphs (orange, P < 0.01 and green P < 0.05).