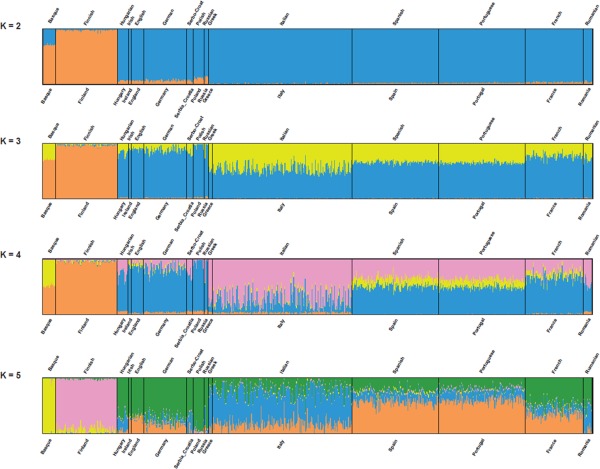
Figure 4.

Unsupervised ancestry‐inference analysis based on the software ADMIXTURE. Each individual genotype is represented by a column in the area representing the appropriate population, and colors correspond to the fraction of the genotype that can be attributed to each of the K groups (2 ≤ K ≤ 5) assumed to have contributed to the populations' ancestry.
