Figure 5.

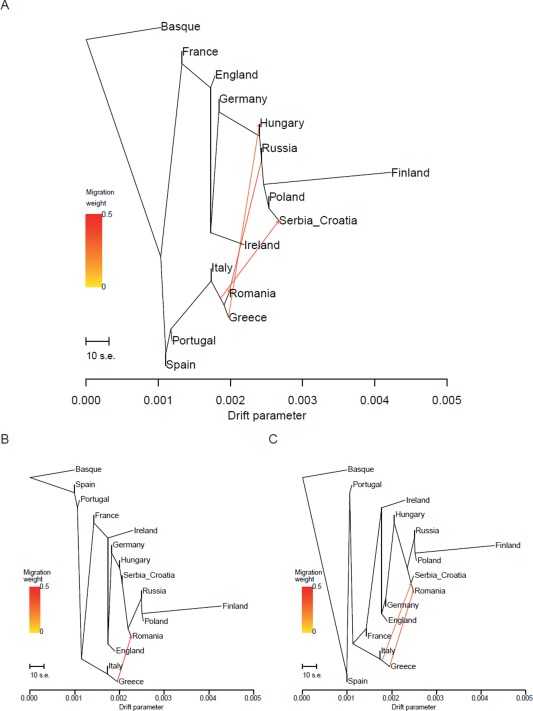
Maximum‐likelihood population trees. The algorithm chosen, TreeMix (28), estimates phylogenetic relationships with (A) three, (B) one, and (C) two superimposed migration events after the main population splits.

Maximum‐likelihood population trees. The algorithm chosen, TreeMix (28), estimates phylogenetic relationships with (A) three, (B) one, and (C) two superimposed migration events after the main population splits.