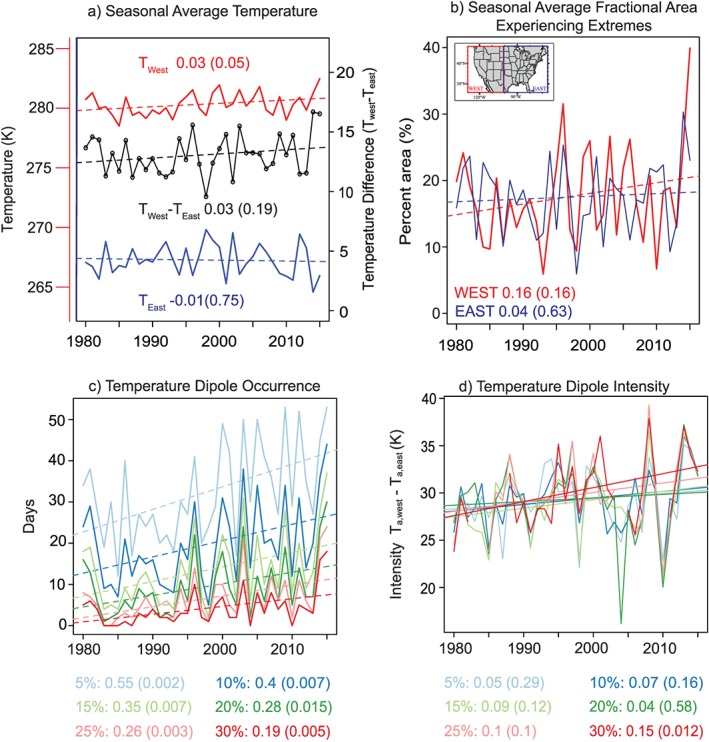
Figure 2.

North American winter temperature dipole (NAWTD) characteristics: Time series (1980–2015) of (a) seasonal average of daily maximum/minimum temperatures in the western and eastern U.S. domains (left axis) and their difference (right axis), (b) seasonal average fractional area of western/eastern domains experiencing warm/cool extremes, (c) temperature dipole occurrence, and (d) seasonal average temperature dipole intensity. Dipole intensity is defined as the difference in area‐weighted average temperature between the western (T a,west) and eastern (T a,east) domain for all grid cells exceeding the extreme thresholds. Colors in Figures 2c and 2d represent the minimum land fractions experiencing extremes used to define the dipole events. The numbers in Figures 2a and 2b and below Figures 2c and 2d indicate the linear trend magnitudes and their statistical significance in brackets.
