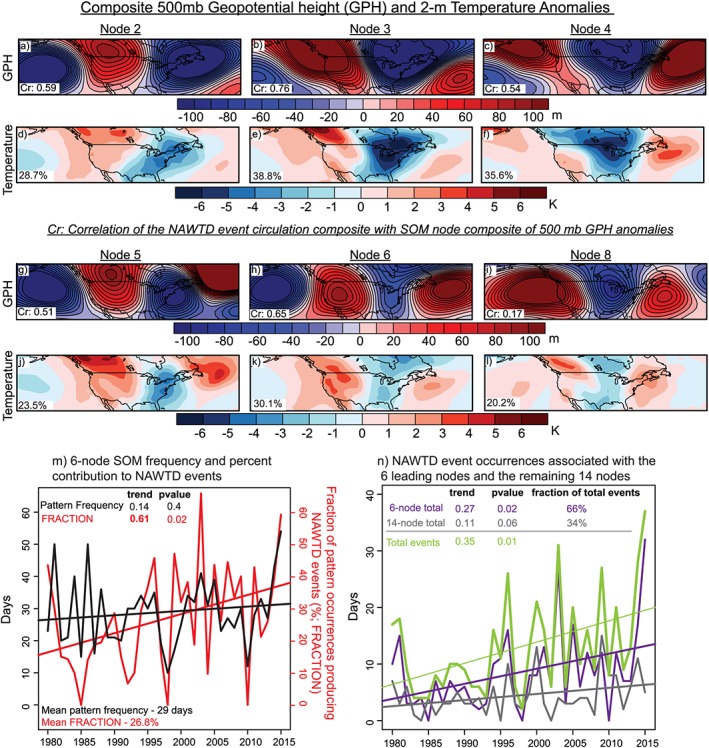
Figure 4.

Related circulation trends: (a–c and g–i) Composite winter (DJF) mid‐tropospheric geopotential height anomalies and (d–f and j–l) corresponding near‐surface temperature anomalies for six of the 20 SOM cluster patterns (see Figure S2 for all cluster composites). We display the six leading patterns with the highest spatial correlation (Cr) to the (15% minimum area) NAWTD event geopotential height composite (Figure 1b). Percentages in Figures 4d–4f and 4j–4l indicate the fraction of SOM occurrences that are associated with NAWTD events at the surface. These six patterns collectively account for 66% of all NAWTD events. (m) Time series of occurrence of the six SOM nodes (sum) and the fraction of these six SOM node occurrences that produce dipole events. (n) Time series of the total number of NAWTD events, dipole events associated with the six leading nodes, and dipole events associated with the remaining 14 nodes.
