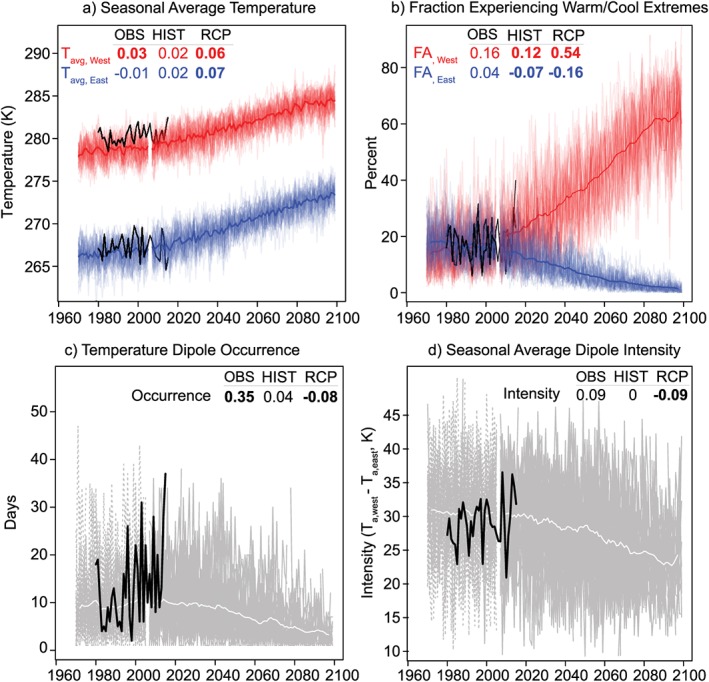
Figure 6.

Historical and future trends: Historical (1920–2005) and RCP8.5 (2006–2100) 35‐member LENS time series of winter (DJF) season (a) western and eastern domain average temperatures, (b) domain average land fraction in the west/east exceeding grid‐cell warm/cool thresholds, (c) frequency of 15% NAWTD event occurrences, and (d) seasonal average intensity of 15% NAWTD events. NCEP/NCAR R1 data are the solid black line in all panels. The heavy red, black, and white lines are the 5 year moving average of the 35‐member LENS ensemble mean. The numbers in each panel indicate the magnitude of the linear trend of each metric in the reanalysis (OBS) and the LENS ensemble average in historical (HIST) and RCP8.5 experiments. Trend magnitudes are bold if significant at the 5% level.
