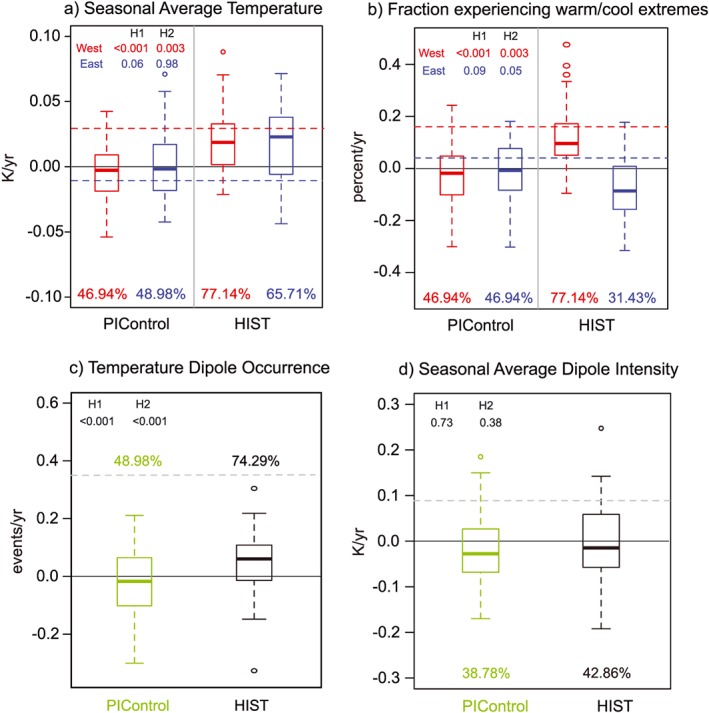
Figure 7.

Trend attribution: Pre‐industrial (PIcontrol) and historical (HIST) LENS simulations of 36‐year winter season (DJF) trends in (a) western and eastern domain average temperatures, (b) domain average land fraction in the west/east exceeding grid‐cell warm/cool thresholds, (c) frequency of 15% NAWTD event occurrences, and (d) seasonal average intensity of 15% NAWTD events. The box‐whisker plots present the standard distribution percentiles (5th, 25th 50th, 75th, and 95th), while the open circles depict outlier trends. The dashed red and blue lines in Figures 7a and 7b and the grey lines in Figures 7c and 7d indicate the magnitude of the NCEP/NCAR R1 trends. Percentages of positive trends are indicated above/below box‐whisker plots (see Table S1 for the fraction of these trends that are significant at the 5% level in the PIcontrol and HIST climates). P‐values from binomial tests to assess—(H1) whether the likelihood of positive/negative trends is equal in the historical and pre‐industrial climate and (H2) whether the likelihood of trends in the direction of observations (positive/negative) is higher in the historical climate relative to the pre‐industrial climate, are indicated in the top left of each panel.
