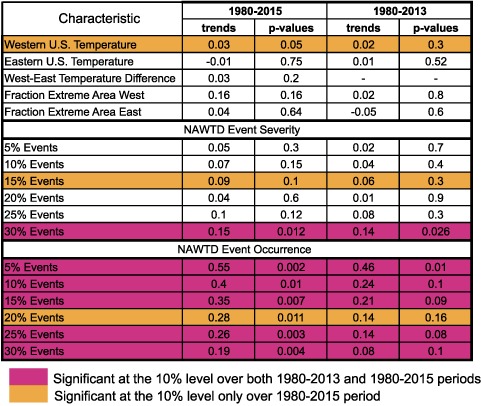
Table 1.
Sensitivity of Trends to Extreme Winter Seasons: Comparison of Linear Trend Magnitudes and Their Significance in Seasonal and Extreme Winter (DJF) Temperature Characteristics Calculated Over the 1980–2015 Period and Over the 1980–2013 Period

The purple highlights characteristics that are significant at the 10% level over both 1980–2013 and 1980–2015. The orange highlights characteristics that are only significant at the 10% level over 1980–2015 period and have P‐values > 0.1 over 1980–2013.
