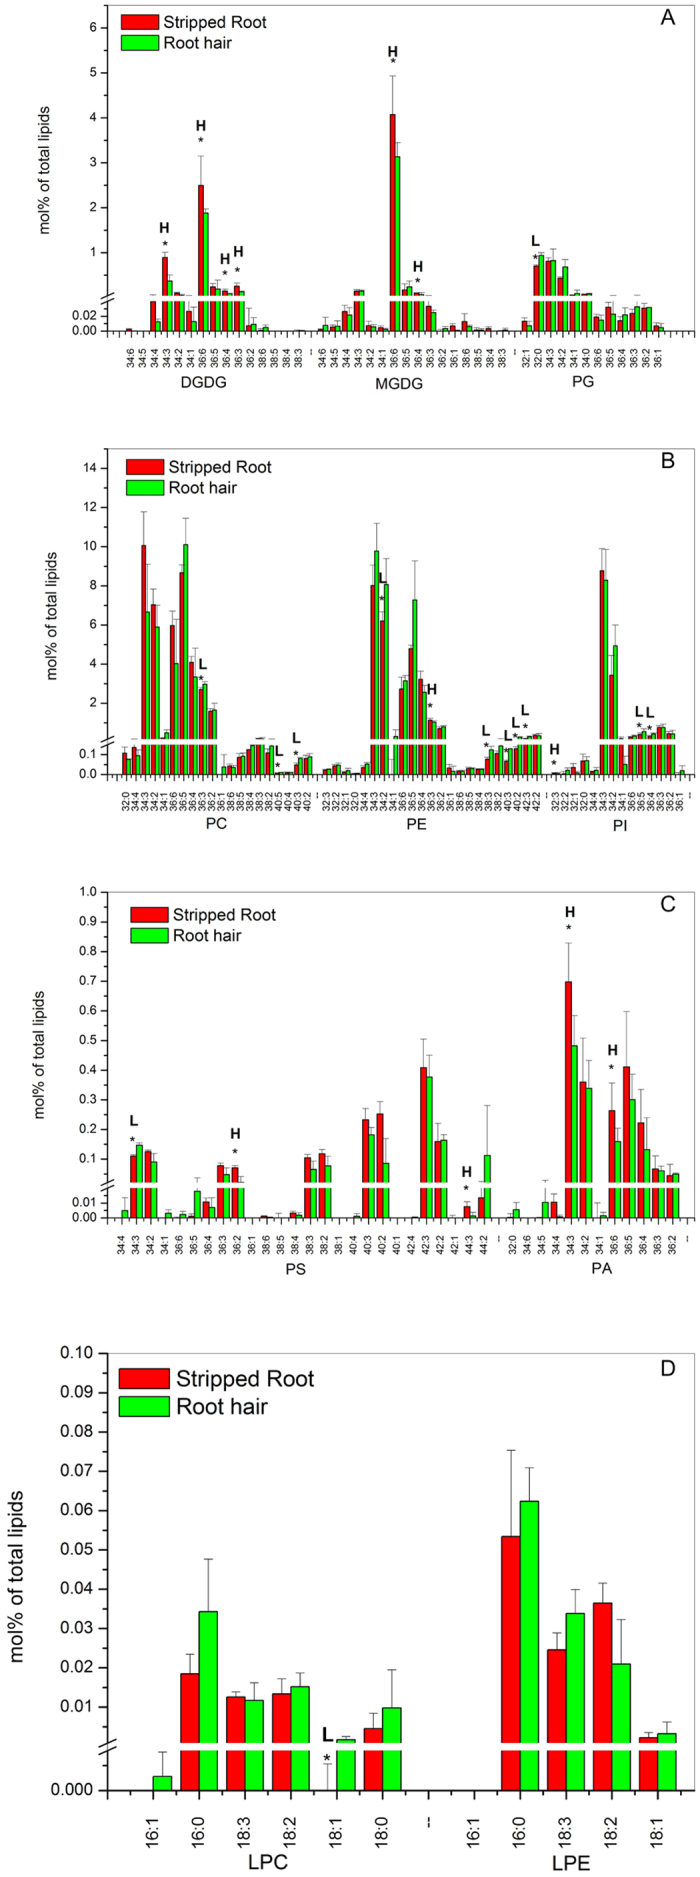
Figure 2. Glycerolipid molecular species in soybean root hairs and stripped roots.

Lipids were extracted from stripped roots and root hairs collected from 7-day-old seedlings. Each glycerolipid molecular species is expressed as normalized mass spectral signal/total normalized glycerolipid mass spectral signal (to produce percentage of normalized MS signal, mol% of total lipids). The values are the mean ± SD (n = 10). The data of soybean stripped root and root hair were compared via t test and the P < 0.05 is indicated by *, indicating a significant difference. The value for stripped roots is higher (represented as H) or lower (represented as L) than the value for root hairs.
