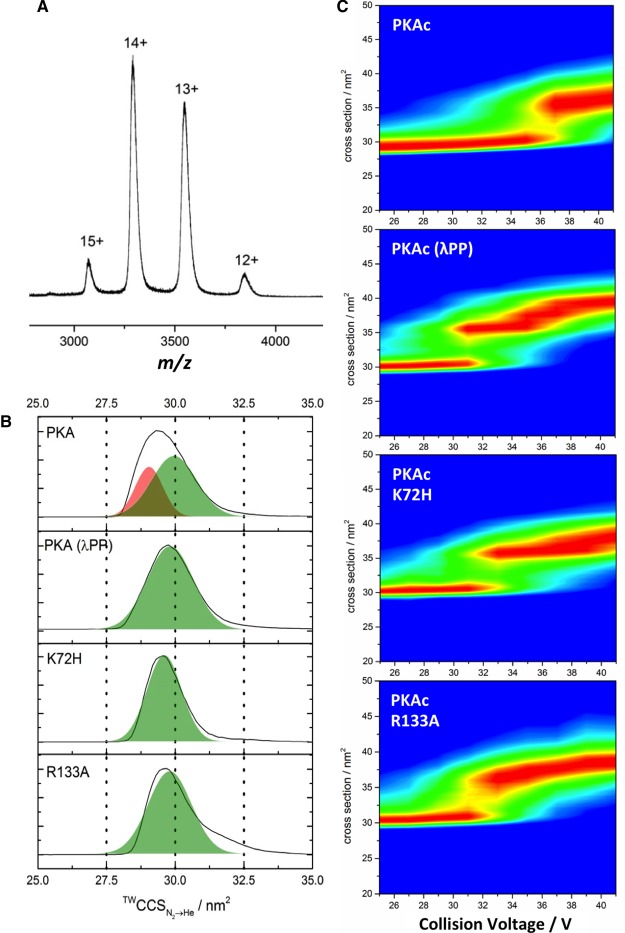
Figure 2. IM-MS of PKAc variants reveals conformationally distinct forms.
(A) ESI mass spectrum of PKAc obtained under nondenaturing ‘native’ conditions. (B) TWCCSN2→He for the [M+13H]13+ form of untreated WT PKAc (PKA), PKAc following treatment with Mn2+-λ protein phosphatase (PKA λPP), and the K72H and R133A variants. Two overlapping conformations of PKA are indicated, the more extended of which (green) matches the CCSD of the other PKA species. (C; top to bottom) CIU profiles of PKAc WT, λPP-treated, K72H and R133A.

