
Figure 7. Binding of small-molecule inhibitors to PKAc and effect on disruption of PKA holoenzyme by PKI.
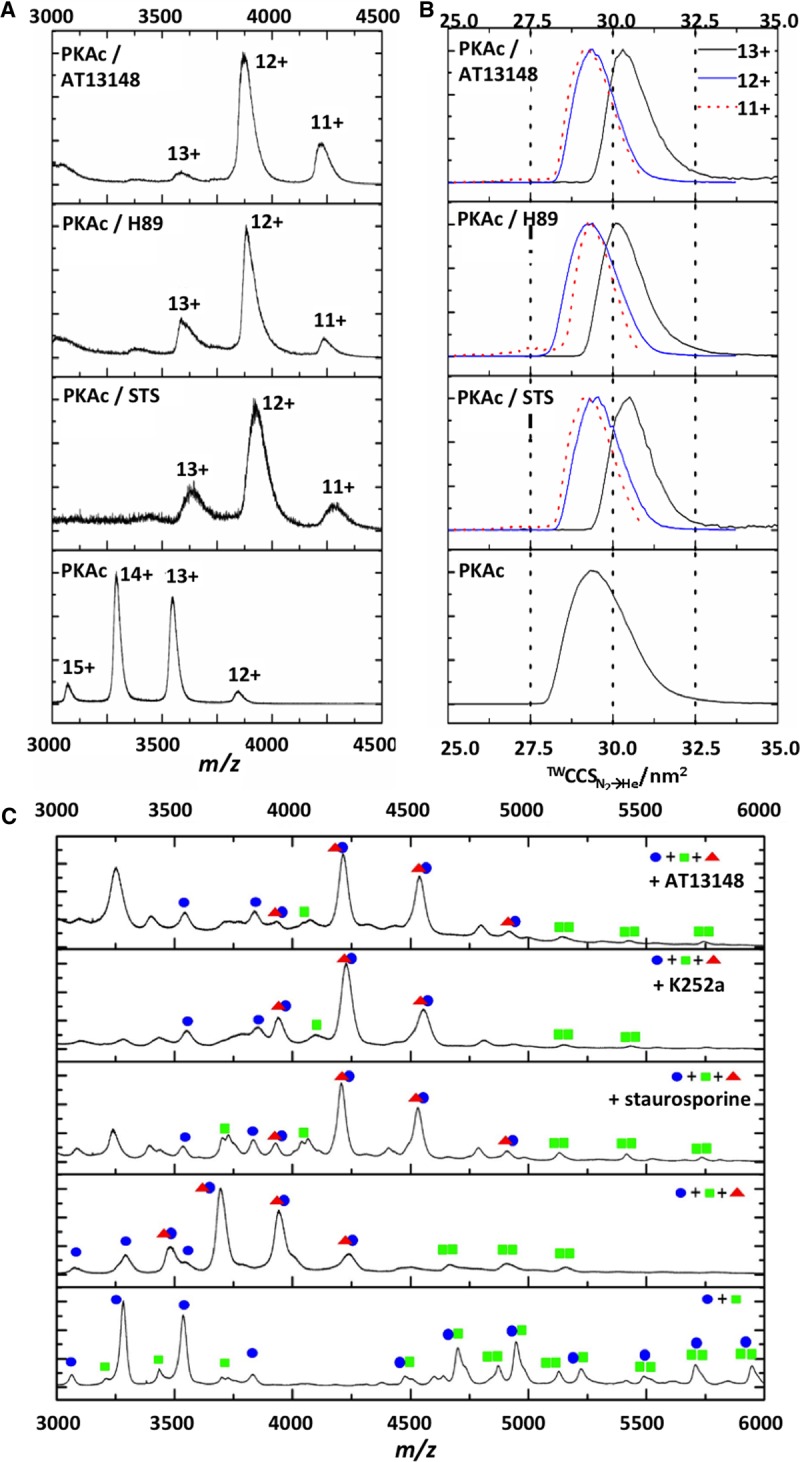
Native ESI mass spectra (A) and TWCCSN2→He distributions (B) acquired in the presence of DMSO vehicle or with 10-fold molar excess of staurosporine (STS), H89 or AT13148. CCSD are presented for [M+11H]11+ (red dotted line), [M+12H]12+ (blue line) and [M+13H]13+ (black line). (C) Equimolar ratios of WT PKAc (C, blue dots) and PKA RIIα (R, green squares) were preincubated with vehicle control, STS, K252a or AT13148, prior to the addition of equipmolar PKI (red triangles). Native ESI spectra are annotated with identified complexes.