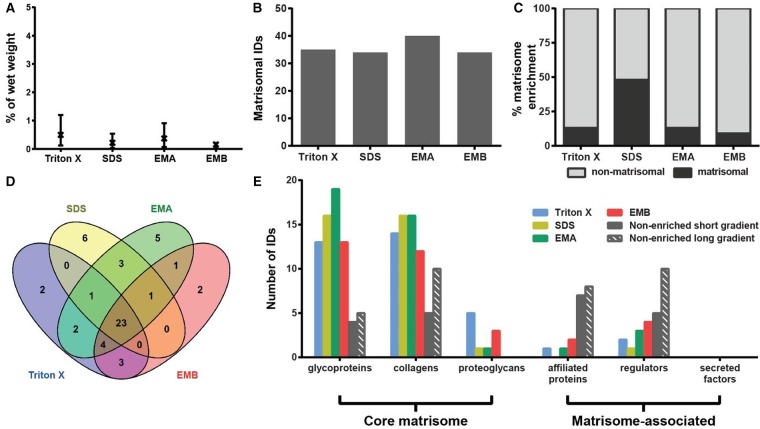
Figure 5. Comparison of methods for enrichment of the liver matrisome.
(A) Percentage protein extraction yield after enrichment by individual methods. Results from three biological replicates are shown as mean and range (n = 3). (B) Number of matrisomal proteins identified (IDs) after enrichment. (C) Proportional representation of identified matrisomal and non-matrisomal proteins after enrichment. (D) Venn diagram depicting the overlap of identified matrisomal proteins across the individual enrichment methods. (E) Distribution of proteins identified (IDs) in matrisomal classes for enriched and non-enriched samples. Only proteins detected in at least two biological replicates were considered.

