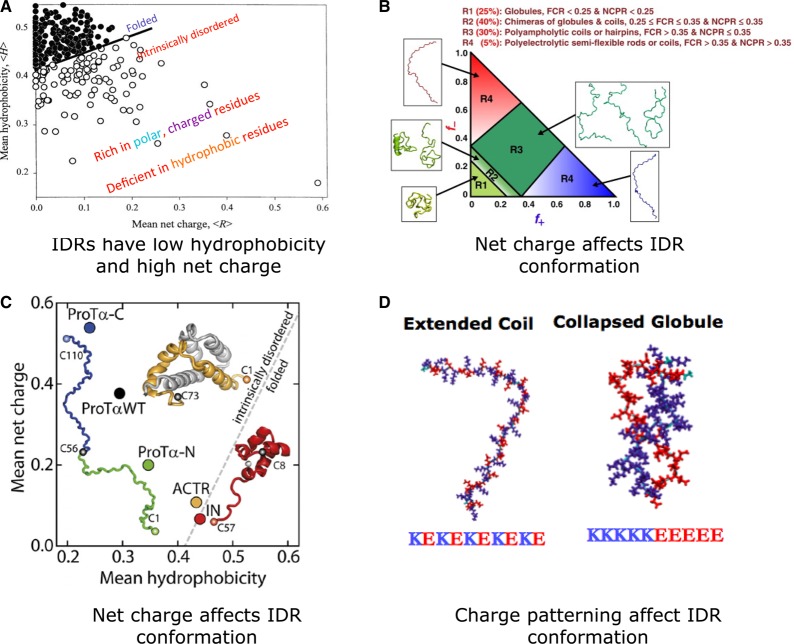
Figure 2. The relationship between sequence composition and conformations adopted by IDRs.
(A) Plot of mean net charge versus mean hydrophobicity reveals the clear separation between structured proteins and IDPs. Reprinted with permission from ref. [31]. (B) Phase diagram showing the conformations of IDRs for different fractions of positive (f+) and negative charges (f−). Reprinted with permission from ref. [38]. FCR, fraction of charged residues; NCPR, Net charge per residue. (C) IDRs with sufficient hydrophobicity tend to fold upon binding (yellow, ACTR). Reprinted with permission from ref. [157]. ACTR, activator for thyroid hormones and retinoid receptors; ProTα-C, prothymosin α C-terminal segment; ProTα-WT, prothymosin α wild type; ProTα-N: prothymosin α N-terminal segment; IN, HIV integrase. (D) For the same net charge, the patterning can determine if the IDR adopts an extended coil or a collapsed globule conformation. Reprinted with permission from ref. [40].

