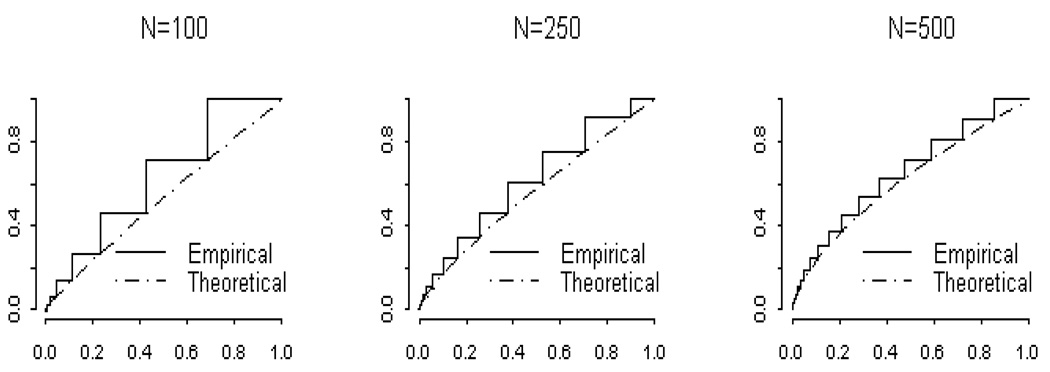
Figure 1.
Comparison of the empirical and theoretical χ2 p-value distributions under the alternative hypothesis when the odds ratio under the alternative hypothesis is 1.2. Population parameters under the null were π11 = 0.25, π10 = 0.25, π01 = 0.25, π00 = 0.25 and under the alternative were δ11 = 0.26, δ10 = 0.24, δ01 = 0.24, δ00 = 0.26.

