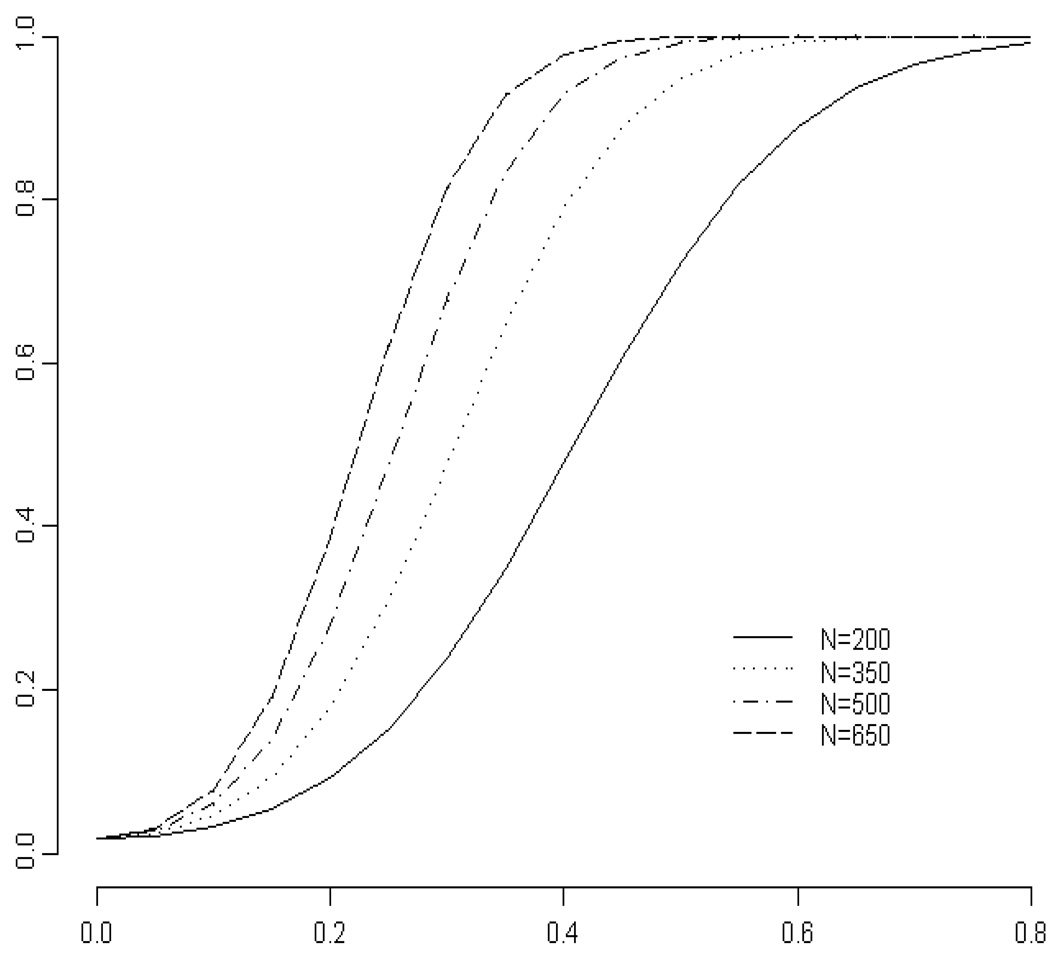
Figure 3.
Average power curve for the Benjamini and Hochberg (1995) procedure for three independent studies using the general linear multivariate model. Here the Hotelling-Lawley trace, the Pillai-Bartlett trace and Wilks’ lambda test coincide. The hypothesis for each study is that there is no association between a single nucleotide polymorphism and visceral adiposity and insulin sensitivity. The false discovery rate was set at 0.05. The population proportion of individuals in each study of individuals with the SNP of interest was set at 0.10. The difference between the normal population and those with any SNP in both visceral adiposity and insulin sensitivity was varied to examine the effect on power.

