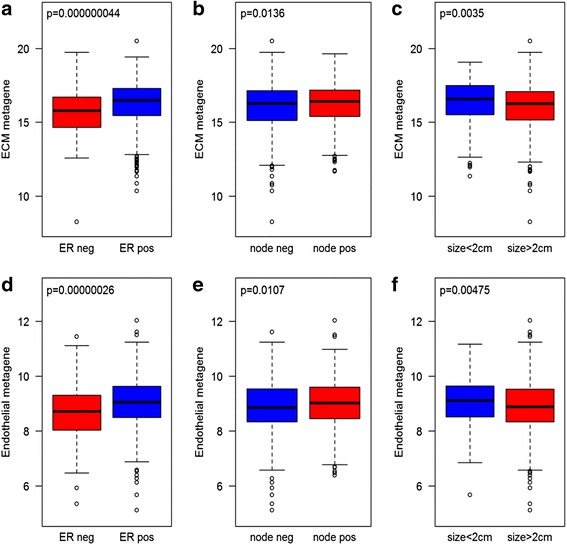
Fig. 2.

Expression levels of ECM and endothelial metagene in TCGA breast cancer tumors. Graphs demonstrate mean log2 expression levels of genes in the ECM and endothelial gene signatures in individual tumors grouped according to ER status (a and d), lymph node involvement (b and e), and tumor size (c and f)
