
Fig. 3.
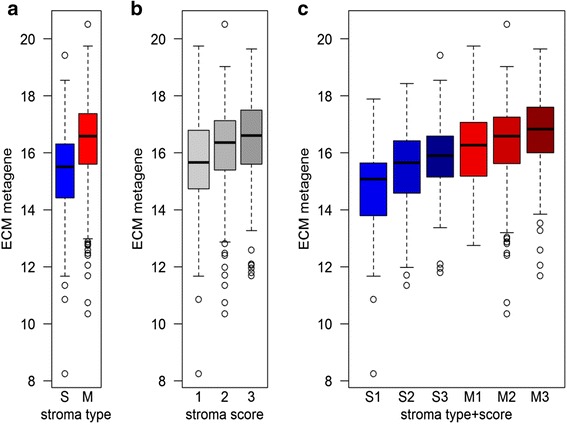
Expression levels of the ECM metagene in breast cancer tumors related to stroma morphology. The mean log2 expression levels of genes in the ECM gene signature are shown for TCGA breast tumors categorized as predominantly having separated (S) or mixed (M) stromal pattern (a), or based on a score of the total amount of tumor stroma (b). c demonstrates the expression level with respect to both stroma type and stroma score