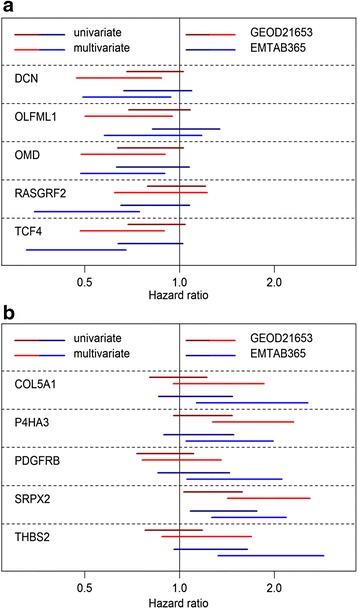
Fig. 5.

Association of individual genes in the prognostic signatures with prognosis in breast cancer microarray sets. The association with prognosis of the expression of individual genes in the good (a) and poor (b) prognosis signatures was analyzed using Cox proportional hazards modeling. Figures demonstrate 95 % confidence interval of the hazard ratio for the standardized log2 mRNA expression of indicated genes in a univariate (dark colors) or multivariate (bright colors) model. In the latter case the aggregated value of the poor prognosis signature (a) or good prognosis signature (b) was used as additional variable in the model
