
Fig. 6.
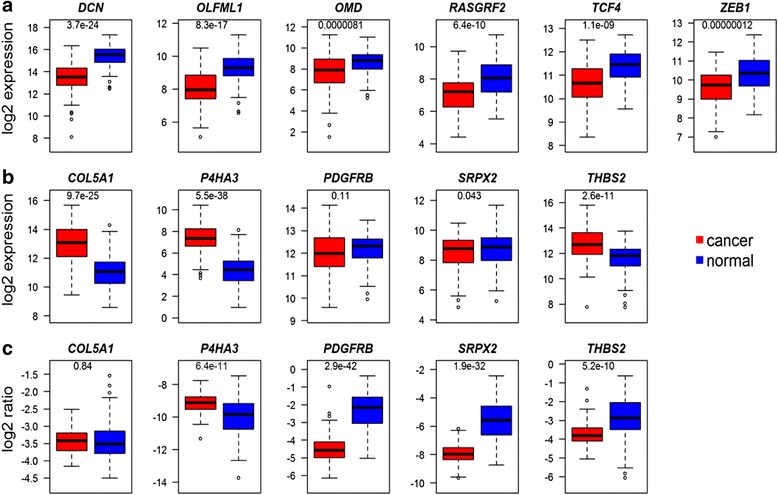
Expression of genes in prognostic signatures in breast cancer versus normal tissue. The mRNA levels of the genes in the good (a) and poor (b) prognosis signatures in TCGA breast cancer tumors and normal breast tissue from the same patient. Since the ECM metagene is expressed at higher levels in cancer tissue the levels of the genes in (b) were normalized to the mean log2 value of the ECM metagene (c). The p-value of a t-test comparing the two groups is indicated in each figure