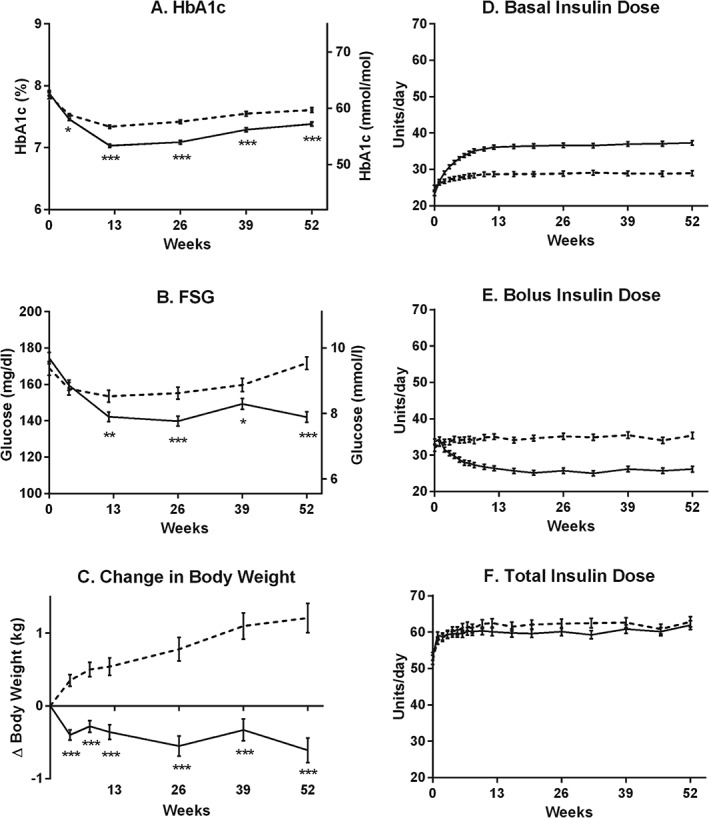
Figure 1.

Outcome measures and insulin doses by weeks of treatment. (A) HbA1c (%, mmol/mol). (B) FSG (mg/dl, mmol/l). (C) Change from baseline in body weight (kg). (D) Basal insulin dose (U/day, p < 0.05 for treatment differences from weeks 2 to 52). (E) Bolus insulin dose (U/day, p < 0.05 for treatment differences from weeks 2 to 52). (F) Total insulin dose (U/day, p > 0.05 for treatment differences, except for week 32). Dashed lines = glargine; solid lines = BIL. All data are LS mean ± s.e. *p < 0.05, **p < 0.01, ***p < 0.001 for differences between treatments.
