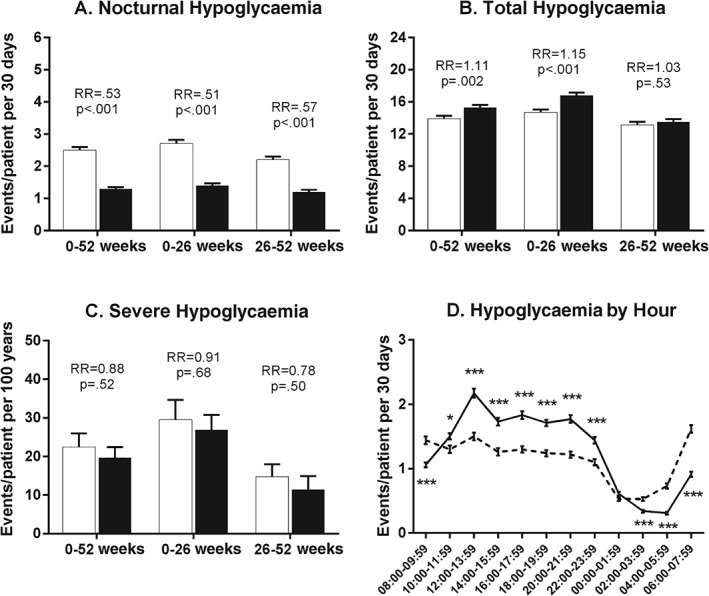
Figure 2.

Hypoglycaemia rates during the study. (A) Nocturnal hypoglycaemia rates for overall, first half and second half of treatment period [events/patient/30 days; group mean ± standard error (s.e.)]. (B) Total hypoglycaemia rates for overall, first half and second half of treatment period (events/patient/30 days; group mean ± s.e.). (C) Severe hypoglycaemia rates for overall, first half and second half of treatment period (events/100 patient years; aggregated rate ± s.d.). White bars = glargine; black bars = BIL. (D) Hypoglycaemia rate in 2‐h intervals (group mean ± s.e.) at 52 weeks. Dashed line = glargine; solid line = BIL; RR = relative rate BIL/glargine. *p < 0.05, **p < 0.01, ***p < 0.001 for differences between treatments.
