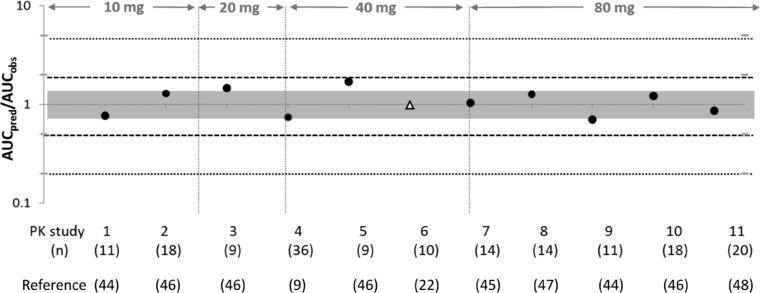
Figure 2.

Plot summarizing the ratio of predicted over observed AUCs of 10‐, 20‐, 40‐, and 80‐mg doses of rosuvastatin. The gray area indicates a 1.25‐fold over‐ or underprediction, the dashed lines indicate 2‐fold over‐ or underprediction, and the dotted lines represent 5‐fold over‐ or underprediction. The black circles represent the mean AUC ratios (predicted/observed) that were used in testing of the updated rosuvastatin compound file,9 , 44, 45, 46 , 48 and the Caucasian triangle represents the AUC ratio from a study that was also used in model development.22 The study numbers (Table 2) and number of subjects in each study are indicated below the plot. The dose studied in each study is indicated on the top.
