
Figure 3.
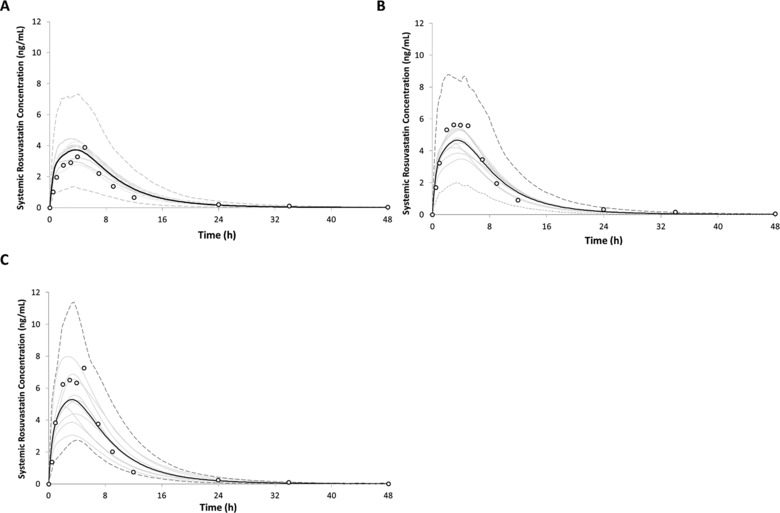
Simulated and observed plasma concentration‐time profiles of rosuvastatin in healthy volunteers following oral administration of a 10‐mg dose in healthy volunteers stratified based on OATP phenotype as (A) extensive transporter (ET), (B) intermediate transporter (IT), or (C) poor transporter (PT). The black lines indicate the mean concentration for the simulated population (n = 160) matched to the observed study design with respect to age, sex, and subject number. Trial means are indicated using the solid gray lines. The dashed gray lines represent the upper (5th) and lower (95th) percentiles for the simulated concentrations. Empty circles represent observed mean values from the reference clinical study.13