
Figure 4.
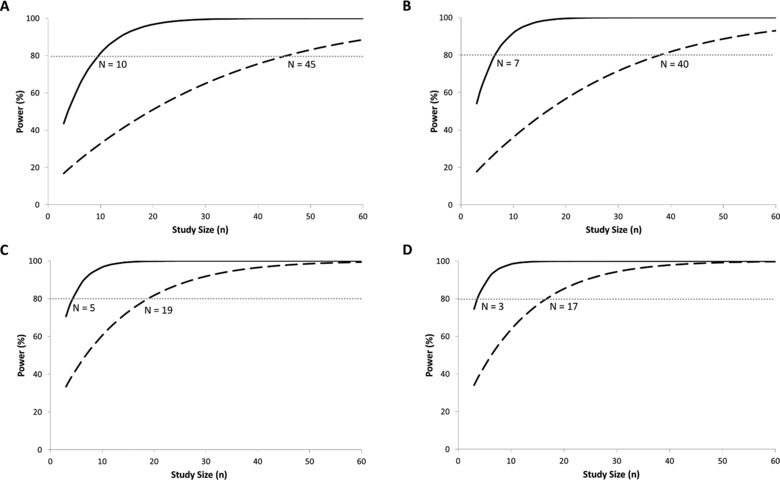
Outputs of simulations depicting the statistical power of detecting differences in rosuvastatin AUC0‐48h in the presence of OATP polymorphisms using the extended rosuvastatin model (A) without OATP1B1‐1B3 colinearity, (B) with OATP1B1‐1B3 colinearity, (C) OATP CV = 0, and (D) all transporters, CV = 0. The solid black line represents the poor transporter population, and the dashed black line represents the intermediate transporter population. The dashed gray line indicates the point at which 80% power to discriminate the AUC of rosuvastatin from the extensive transporter phenotype individuals has been reached. The intersection of the respective PT and IT lines with this dashed gray line indicates the minimum number of subjects required from each phenotype group.