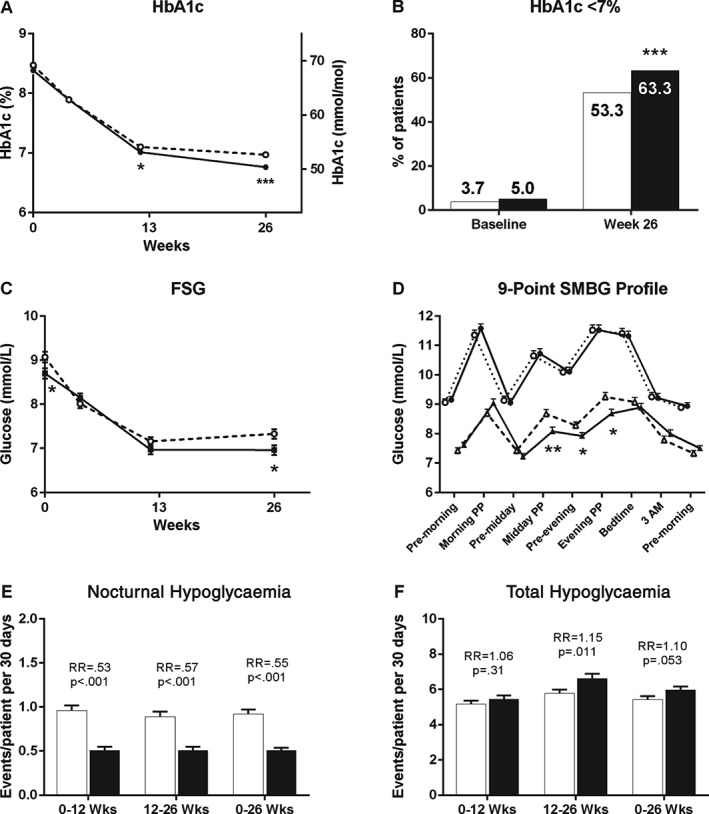
Figure 1.

Glycaemic and hypoglycaemia outcome measures over 26 weeks of treatment for basal insulin peglispro (BIL)‐ and glargine‐treated patients. (A) Glycated haemoglobin (HbA1c) over time [least squares (LS) mean ± standard error (s.e.)]. (B) Proportion of patients with HbA1c <7% at baseline and 26 weeks. (C) Fasting serum glucose (FSG) over time (LS mean ± s.e.). (D) Nine‐point SMBG profiles by treatment at baseline and 26 weeks (LS mean ± s.e.). (E) Nocturnal hypoglycaemia rate (group mean ± s.e.). (F) Total hypoglycaemia rate (group mean ± s.e.). White markers or bars/dashed line = glargine; black markers or bars/solid line = BIL. PP, 2‐h postprandial; RR, relative rate; SMBG, self‐monitored blood glucose. *p < 0.05; **p < 0.01; ***p < 0.001 for differences between treatments.
