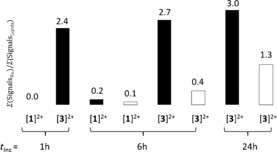
Figure 3.

Ratio of Ru‐based/cell‐based signals observed by MALDI‐MS after different cell treatment conditions. Black bars correspond to samples kept in the dark, white bars to irradiated cells (λ=454 nm, 10 min, 6.3 J cm−2). Incubation times before refreshing of medium and irradiation are indicated.
