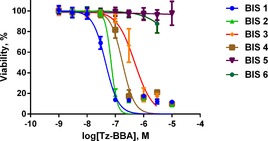
Figure 1.

HCT116 cell viability. Dose–response curves determined by an alamarBlue cell viability assay after incubation with Bis1–6 (0.003–10 μm) for 72 h. Conversion of the alamarBlue reagent to the activated fluorescent resorufin cell viability indicator was calculated for DMSO (vehicle) and compound‐treated samples. Viability is expressed relative to control (DMSO). Dose–response plots are mean±SD (n=3). EC50 values of 45 (Bis1), 71 (Bis2), 483 (Bis3) and 178 nm (Bis4) were also obtained.
