
Figure 2.
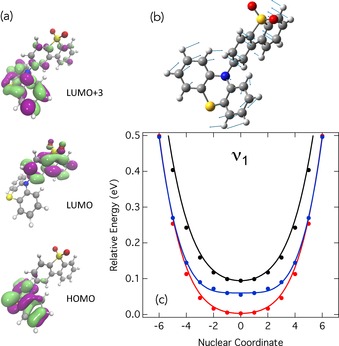
a) Molecular orbitals most involved in the low‐lying excited states (3LE, 3CT and 1CT) considered herein. b) Nuclear displacements, corresponding to a torsion of the D–A angle, associated with the lowest molecular normal mode (v 1) of PTZ‐DBTO2. c) Potential energy curves of the low‐lying excited states (3LE=red, 3CT=blue and 1CT=black) relative to the 3LE energy minimum calculated using TDDFT (dots). The solid lines corresponds to the fit of the model vibronic coupling Hamiltonian to these potentials.