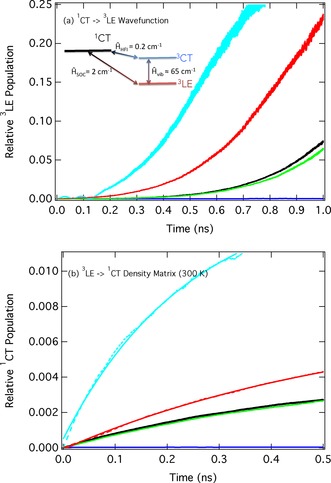
Figure 3.

a) Relative populations of the 3LE state associated with intersystem crossing after excitation into the 1CT state. The inset is a simplified schematic representation of the model Hamiltonian used. b) The relative populations of the 1CT state associated with reverse intersystem crossing after initially populating the 3LE state. Black: full model Hamiltonian described in Table S3, green: no HFI, blue: No Vibronic Coupling, red: vibronic coupling increased by 10 %, cyan: energy gap between 3LE and 3CT halved.
